[Report 1917-1918] / Medical Officer of Health, Nottinghamshire County Council.
- Nottinghamshire (England). County Council.
- Date:
- 1918
Licence: Attribution 4.0 International (CC BY 4.0)
Credit: [Report 1917-1918] / Medical Officer of Health, Nottinghamshire County Council. Source: Wellcome Collection.
11/100 (page 11)
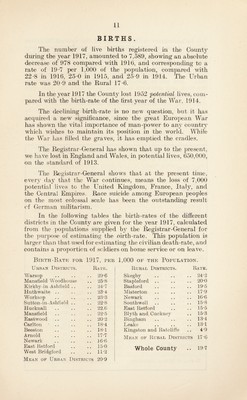
![BIRTHS. The number of live births registered in the County during the year 1917, amounted to 7,589, showing an absolute decrease of 978 compared with 1916, and corresponding to a rate of 19-7 per 1,000 of the population, compared with 22-8 in 1916, 25-0 in 1915, and 25*9 in 1914. The Urban rate was 20-9 and the Rural 17-6. In the year 1917 the County lost 1952 potential lives, com¬ pared with the birth-rate of the first year of the War, 1914. The declining birth-rate is no new question, but it has acquired a new significance, since the great European War has showm the vital importance of man-power to anj countrj^ which wishes to maintain its position in the world. While the War lias filled the graves, it has emptied the cradles. The Registrar-General has showm that up to the present, we have lost in England and Wales, in potential lives, 650,000, on the standard of 1913. The Registrar-General shows that at the present time, everv dav that the War continues, means the loss of 7,000 potential lives to the United Kingdom, France, Italy, and the Central Empires. Race suicide among European peoples on the most colossal scale has been the outstanding result of German militarism. In the following tables the birth-rates of the different districts in the County are given for the year 1917, calculated from the populations supplied b} the l^gistrar-General for the purpose of estimating the oirth-rate. This population is larger than that used for estimating the civilian death-rate, and contains a proportion of soldiers on home service or on leave. Birth-Eatu for 1917, per Urban Districts. Rate. Warsop .. .. .. 29-6 Mansfield Woodhouse .. 25'8 Kirkby-in-Ashfield .. .. 24-7 Huthwaite .. .. .. 23-4 Worksop .. .. .. 23‘3 Sutton-in-Ashfield .. .. 22-8 Hucknall .. .. .. 22.6 Mansfield .. .. .. 22-5 Eastwood .. .. .. 20-2 Carlton ' .. .. .. 18-4 Beeston .. ., .. 18-1 Arnold .. .. .. 17-7 Newark .. .. .. ]6‘6 East Retford .. .. 15’0 West Bridgford .. .. 11-2 Mean of Urban Districts 20-9 1,000 OF THE Population. Rural Districts. Rate. Skegby . 24-2 Stapleford 20-0 Basford 19*5 Misterton 17-9 Newark 16-6 Southwell 15-8 East Retford 15*5 Blyth and Cuckney 15-3 Bingham .. 13-4 Leake 13-1 Kingston and Ratcliffe 4-9 Mean op R,ubal Districts 17-6 Whole County 19-7](https://iiif.wellcomecollection.org/image/b29925149_0011.jp2/full/800%2C/0/default.jpg)