Annual statistical returns and short notes on vaccination in Bihar and Orissa.
- Bihar and Orissa (India)
- Date:
- [1925]
Licence: Public Domain Mark
Credit: Annual statistical returns and short notes on vaccination in Bihar and Orissa. Source: Wellcome Collection.
10/34 (page 6)
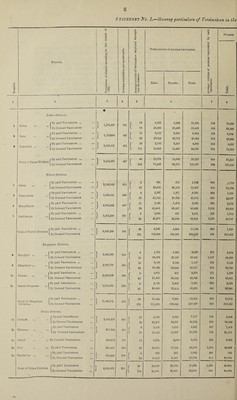
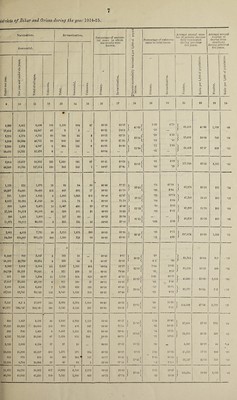
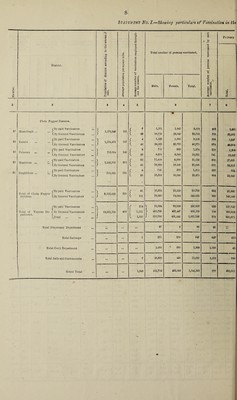
![S TATEMENT No. I.—Showing particulars of Vaccination in the Number. District. Population of district according to the census of 1921. • Average population per square mile. Average number of vaccinators ompioyed through¬ out the season. / Average liumhor of persons vaccinated by each vaccinator. Primary Total num Male. her of persons r Female. -accinated. ( Total. O H 1 • 2 3 4 6 6 7 8 « Tatna Division, 1 Patna (By paid VaecinatoTS ... ... ]• 1,574,287 761 f 1 18 6,262 6,326 11,688 644 10,398 (.By licensed Vaccinators ) ( 63 23,9G0 20,503 55,463 830 65,460 3 Gaya By paid Vaccinators ... •y > 2,152)1930 467 c 15 3,612 3,282 6,894 459 6,788 (By licensed Vaccinators ) ( 82 23,819 23,275 47,094 674 46,845 ft Sliahabad ... (By paid Vaccinators ... ... f 1,816,821 415 f 16 2,705 2,288 4,993 312 4,639 (.By licensed Vaccinators J ( 111 18,803 16,497 35,300 318 35,300 ( By paid Vaccinators ... ... v C 49 12,579 10,896 23,475 480 21,825 Total of Patna Division-; f 6,544,038 497 (. By licensed Vaccinators • •• ) L 256 71,532 66,275 137,857 638 137,605 Tirliut Division, rBy paid Vaccinators ... ... c 6 921 Oil 1,832 866 1,750 4 Saran ... ... 1 ’ f 2,339,953 872 4 (.By licensed Vaccinators ) 83 89,388 36,109 75,497 909 75,054 { By paid Vacciuators ... ... c 4 2,267 1,471 3,738 934 1,858 l Cliamparan > 1,940,841 549 4 i. By licensed Vaccinators ... ) l 66 21,715 20,393 42,108 638 42,007 t By paid Vaccinators ... ... ■) c 11 2,095 1,474 3,569 824 2,512 e MuzafTarpur ...J 5- 2,754,945 007 4 (.Bylicensed Vaccinators ... ) l 79 45.4S5 43,407 88,892 1,125 88,604 rBy paid Vaccinators ... ... ■) c 6 1,064 947 2,011 336 1,814 9 Darbbanga ...) ' ‘ > 2,913,529 870 ) (.By licensed Vaccinators ... ) l 88 45,676 43,649 89,325 1,015 88,787 ('Ey paid Vaccinators ... 1 ( 26 6,347 4,903 11,150 429 7,934 Total of Tirliut Division-! >- 9,949,268 789 4 C By licensed Vaccinators ... ) l 316 152,264 143,558 295,822 936 294,432 Dhagalpui' Division, ( By paid Vaccinators ... c 6 1,178 1,069 2,241 374 2,084 e Mongbyr ... > 2,029,965 518 4 (. By licensed Vaccinators ... ) 59 30,286 29,107 59,453 1,007 69,230 rBy paid Vaccinators ... ) r 16 6,019 3,138 8,157 610 5,189 e Bhagalpur ... -1 2,033,770 481 4 (By licensed Vaecmators 4 63 30,069 29,048 69,117 933 68,746 rBy paid Vaccinators ... ) r 9 1,618 817 2,435 271 1,299 10 Purnea ... ..A } 2,024,608 405 ) (By licensed Vaccinators ) L 63 21,903 20,036 42,542 803 42,231 r By paid Vaccinators ... ) 8 4,! 29 2,906 7,035 679 6,332 n Santal Pargauas ... y 1,798,639 329 4 (By licensed Vaccinators ) l 67 28,905 27,010 65,975 9S2 53,335 rBy paid Vaccinators ... ) r 39 11,944 7,930 19,874 610 13,904 Total of Bhagalpur < 7,886,95 2 423 4 Division. (,By licensed Vaccinators ) l 232 111,226 105,861 217.087 935 213,542 Orissa Division. C By paid Vacciftators ... ) r 10 4.G62 2,855 7,517 752 2,168 12 Cuttack ... ] [ 2,064,678 6C5 > (By licensed Vaccinators ) C 60 22,227 18,507 40,734 658 39,884 r By paid Vaccinators ... ) r 6 3,433 1,528 4,961 827 1,479 13 Balasoro ... 4 > 9S0.504 470 4 (By licensed Vaccinators ) l SO 12,446 10,337 22,783 759 21,159 14 Angul By licensed Vaccinators »•* 182,574 112 12 3,214 8,096 6,310 626 6,283 15 Puri By paid Vaccinators ... 061,651 380 29 20,835 17,344 38,179 1,316 36,608 (By paid Vaccinators ... ) r 4 5S9 453 1,042 260 546 1G Saaibalpur ... ... 4 >• 789,466 206 4 (By licensed Vaccinators ... l 34 10.817 9,961 20,778 611 20,738 rBy paid Vaccinators *> ( 49 29,519 22,180 61,699 1,055 40,801 Total ol Orissa Division < y 4,968,873 3C1 > X (By licensed Vaccinators ... > 138. 48,704 41,901 90,615 660 88,004](https://iiif.wellcomecollection.org/image/b31496477_0010.jp2/full/800%2C/0/default.jpg)