[Report of the Medical Officer of Health for Harrow].
- Harrow (London, England). Urban District Council
- Date:
- [1952]
Licence: Attribution-NonCommercial 4.0 International (CC BY-NC 4.0)
Credit: [Report of the Medical Officer of Health for Harrow]. Source: Wellcome Collection.
10/84 page 8
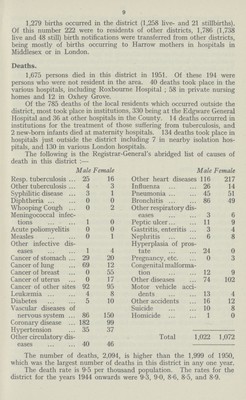
![8 STATISTICS AND SOCIAL CONDITIONS OF THE AREA Area (in acres) 12,559 Registrar-General's estimate of resident population, mid-year 1951 220 000 Rateable Value (April 1st] 1951) £2,219,810 Sum represented by a penny rate (April 1st, 1951) £8,978 Total number of occupied houses 53,613 Total number of occupied flats 7,941 Extracts from Vital Statistics for the Year. Live Births :— Total Male Female Legitimate 2,793 1,454 1,339 Birth rate per 1,000 Illegitimate 102 51 51 population, 13-1 Total 2,895 1,505 1,390 Stillbirths :— Legitimate 70 36 34 Rate per 1,000 total Illegitimate 1 1 — births, 2-4 Deaths 2,094 1,022 1,072 Death rate per 1,000 population, 9-5 Rate per 1,000 Deaths total births Deaths from pregnancy, childbirth 3 1.0 Death rate of Infants under one year of age :— All infants per 1,000 live births 22.1 Legitimate infants 21.8 Illegitimate infants 29.4 Deaths from Cancer 389 „ „ Measles 1 „ „ Whooping cough 2 „ „ Tuberculosis 48 Population. The mid-year population of the district was 220,000, a decrease of 2,300 on the mid-year population for 1950. The natural increase in population, i.e., the excess of births over deaths during the year, was 801. Births. The total number of live births registered during the year was 2,895 (1,505 male and 1,390 female). Of these, 102 were illegitimate, being a percentage of total births of 3.5. The number of live births registered in each of the years from 1944 onwards was 3,473, 3,068, 3,934, 3,828, 3,226, 3,083, 2,848, and 2,895.](https://iiif.wellcomecollection.org/image/b1982452X_0010.jp2/full/800%2C/0/default.jpg)


 No text description is available for this image
 No text description is available for this image
 No text description is available for this image