[Report 1964] / Medical Officer of Health, Benfleet U.D.C., Canvey Island U.D.C., Rayleigh U.D.C., Rochford R.D.C. (South East Essex).
- Benfleet (England). Urban District Council.
- Date:
- 1964
Licence: Attribution 4.0 International (CC BY 4.0)
Credit: [Report 1964] / Medical Officer of Health, Benfleet U.D.C., Canvey Island U.D.C., Rayleigh U.D.C., Rochford R.D.C. (South East Essex). Source: Wellcome Collection.
10/76 page 8
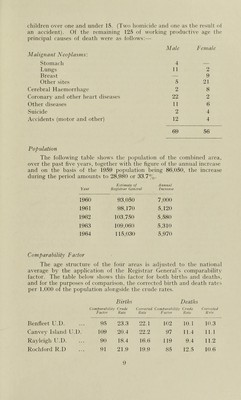
![As in previous years an attempt has been made to analyse the eauses ” of jierinatal mortality where known, as shown by the following table which covers all but a handful of cases in each year. Cause 1963 1964 Idiopathic ju'ematurity, intra-uterine death, and placental insufficiency 18 7 Toxaemia of pregnancy 14 9 Accidents of pregnancy and labour 15 8 Congenital defects 13 11 Erythroblastosis (rhesus factor sensiti- sation) 8 8 Other 2 3 It is noted that there has been a gratifying fall in several categories although congenital defects and erythroblastosis, at present largely uncontrollable, continue to exact their toll. It has been said that the irreducible minimum of perinatal mortality is 15 infants per 1,000 and in South and East England we are within striking distance of this figure. Discussions continue at the local Maternity Liaison Committee to hasten this day. Infant Mortality Rate- While the perinatal mortality rate is the most useful indicator of experience at or about the time of birth, the infant mortality rate is used to measure experience in the first year of life and is the indicator of maternal and community care. It does, however, include deaths in the first week and bearing in mind that numbers of deaths are very small only cautious conclusions can be reached from the study of this rate. In 1964 it was 12.6 for South East Essex as compared with 20.0 for England and Wales and this figure was the lowest reached for many years (see graph). Deaths These decreased by 104 during 1964 to 1,256, representing a death rate of 10.9 per 1,000, iust below the national average. Rayleigh again had the lowest rate (9.4), and Rochford the highest (12.5), owing to the presence there of a large welfare establishment for the aged from a neighbouring local authority. The usual summary of causes of death is shown in Table 1 of Appendix “ A ”. h'rom this it will be observed that diseases of the heart and blood vessels again account for more than half of all deaths (53.3%). The next highest mortality group was cancer, accounting for 18.9%. Respiratory diseases, excluding lung cancer, were responsible for 10.8% of the total. One hundred and sixty-four or 13% of all deaths occurred under the age of 55 years. 31 of these were infants in the first year of life (two from whoo])ing cough and one as the result of an accident), and eight were](https://iiif.wellcomecollection.org/image/b28917236_0010.jp2/full/800%2C/0/default.jpg)