[Report of the Medical Officer of Health for London County Council 1895].
- London County Council (London, England). County of London.
- Date:
- [1896?]
Licence: Attribution-NonCommercial 4.0 International (CC BY-NC 4.0)
Credit: [Report of the Medical Officer of Health for London County Council 1895]. Source: Wellcome Collection.
17/174 (page 9)
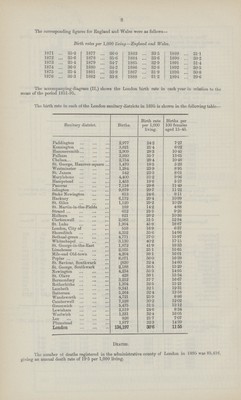
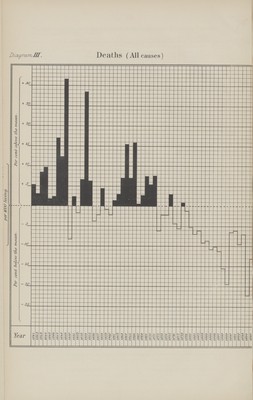
![9 Since the year 1870, the London death rate has been as follows — 1871 24.6 1878 23.1 1885 20.4 1892 20.32 1872 21.5 1879 22.6 1886 20.6 1893 21.02 1873 22.4 1880 21.7 1887 20.3 1894 17.42 1874 22.4 1881 21.3 1888 19.3 1895 19.52 1875 23.6 1882 21.5 1889 18.4 1876 21.9 1883 20.8 1890 21.4 1877 21.6 1884 20.9 1891 21.02 The death rate in each year sincc 1841 in relation to the mean of the period 1841-95 is shown in diagram III. It will be observed that the death rate in 1895, while higher than that of 1894, was lower than the death rate of any of the four years antecedent to 1894. The year 1895 was characterized by a temperature in January and February below the average of the 124 preceding years, and in the summer months above the average. Influenza and bronchitis were more fatal in 1895 than in the previous year, although the deaths were below the average of the ten years antecedent to 1895. Again, diarrhoea, a disease largely dependent on a high summer temperature, was in 1895 more than twice as fatal as in 1894, and slightly exceeded the average of the ten years preceding 1895. The following table has been prepared for the purpose of comparing the death rate of the registration county of London with that of other English towns having populations which exceeded 200,000 persons at the census of 1891. The columns showing death rates corrected for age and sex distribution have been obtained by multiplying the crude death rates by the factor for correction published by the Registrar-General in the annual summary for 1895. All causes. Town. Estimated population, middle of 1395. Crude death rate per 1,000 living. Death rate per 1,000 living (corrected for age and sex distribution). 1885-94. 1895. 1885-94. 1895. London 4,331.119 20.1 19.91 21.4 21.2 Manchester 524,865 25.7 25.2 29.1 28.6 Liverpool 503,967 25.7 28.8 28.5 32.0 Birmingham 496,751 20.6 20.3 22.8 22.4 Leeds 395,546 21.1 20.5 23.4 22.7 Sheffield 342,768 21.7 20.5 24.1 22.8 West Ham 249,473 18.8 17.9 20.3 19.3 Bristol 228,139 19.4 18.1 20.3 18.9 Nottingham 226,658 19.7 19.0 21.2 20.4 Bradford 226,384 20.2 19.9 23.1 22.8 Hull 216,722 19.8 20.8 20.8 21.8 Salford 208,253 24.6 25.6 27.7 28.8 London had, therefore, comparing the corrected death rates in 1895 a lower death rate than that of any of these towns except West Ham, Bristol, Bradford and Nottingham, and in the period 1885-94 a lower death rate than that of any of these towns except West Ham, Bristol, Nottingham and Hull. The following table enables comparison to be made of the death rate of London with that of several foreign cities— All causes. Town. Death rate per 1,000 living. Town. Death rate per 1,000 liring. 1885-94. 1895. 1885-94. 1895. London 20.1 19.91 St. Petersburg 29.7 28.8 Paris 22.8 21.3 Berlin 21.5 19.4 Brussels 20.8 19.8 Vienna 24.7 23.1 Amsterdam 21.4 17.4 Rome 23.9 20.6 Copenhagen 21.3 18.5 New York 24.9 23.3 Stockholm 20.5 17.0 It will be seen that whereas in 1885-94 the death rate of London was lower than that of any of these cities, in 1895 it exceeded the death rates of Amsterdam, Copenhagen, Stockholm, Berlin, and Brussels. In 1885 the Registrar-General began to distribute the deaths from all causes and from certain zymotic diseases, occurring in institutions, to the sanitary districts to which they belong, and death rates of sanitary districts corrected in this sense can therefore be obtained for each of the years 1885-95. For the purpose of a more precise statement, it is necessary to have regard to the age and 1 See footnote (1), page 10. 2 See footnote (2), page 10. [2]](https://iiif.wellcomecollection.org/image/b18252448_0017.jp2/full/800%2C/0/default.jpg)