[Report of the Medical Officer of Health for London County Council 1895].
- London County Council (London, England). County of London.
- Date:
- [1896?]
Licence: Attribution-NonCommercial 4.0 International (CC BY-NC 4.0)
Credit: [Report of the Medical Officer of Health for London County Council 1895]. Source: Wellcome Collection.
18/174 (page 10)
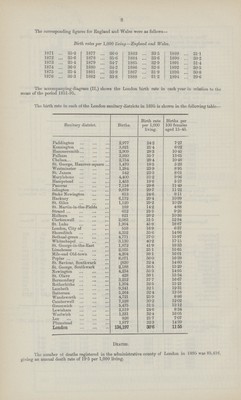
![10 sex distribution of the several populations, and to correct each crude death rate by the proper factor; the following table is thus obtained- — Crude and corrected death rates3 per 1,000 persons living in sanitary districts of London. Sanitary area. Standard death rate. Factor for correction for age and sex distri bution. Crude death rate 1885-94. Corrected death rate, 1885-94. Comparative mortality figure, 1885-94. [ London 1,000.] Crude death rate, 1895. Corrected death rate, 1895. Comparative mortality figure, 1895. [London 1,000.1 England and Wales 19.15 — — — — — — — London 17.96 106626 19'8 211 1,000 19.52 20.8 1,000 Battersea 17.80 1.07584 — — — 17.7 19.0 913 Bermondsey 18.10 1.05801 22.4 23.7 1,123 22.0 23.3 1,120 Bethnal-green 18.39 1.04133 23.2 24.2 1,147 21.5 22.4 1,077 Camberwell 18.10 1.05801 18.5 19.6 929 18.5 19.6 942 Chelsea 17.95 1.06685 20.6 22.0 1,043 19.9 21.2 1,019 Clerkenwell 17.28 1.10822 23.0 25.5 1,209 22.6 25.0 1,202 Fulham 18.27 1.04817 — — — 19.9 20.9 1,005 Greenwich 18.63 1.02791 19.4 19.9 943 19.0 19.5 938 Hackney 18.30 1.04645 — — — 17.8 18.6 894 Hammersmith 18.05 1.06094 — — — 17.6 18.7 899 Hampstead 16.63 1.15153 12.4 14.3 678 12.6 14.5 697 Holborn 17.62 1.08683 25.3 27.5 1,303 25.9 28.1 1,351 Islington 17.90 1.06983 18.3 19.6 929 17.3 18.5 889 Kensington 17.38 1.10184 17.0 18.7 886 16.3 18.0 865 Lambeth 18.24 1.04989 19.5 20.5 972 19.1 20.1 966 Lee 17.67 1.08376 — — — 14.7 15.9 765 Lewisham 17.92 1.06864 14.4 15.4 730 14.3 15.3 736 Limehouse 17.59 1.08869 25.8 28.1 1,332 26.7 29.1 1,399 City of London 16.65 1.15015 22.6 26.0 1,232 22.0 25.3 1,216 Mile-end Old-town 18.58 1.03068 21.2 21.9 1,038 22.1 22.8 1,096 Newington 18.32 1.04531 22.2 23.2 1,100 24.0 25.1 1,207 Paddington 17.72 1.08070 16.7 18.0 853 17.1 18.5 889 Plumstead 19.09 1.00314 — — — 16.0 16.1 774 Poplar 18.49 1.03569 21.0 21.7 1,028 22.9 23.7 1,139 Rotherhithe 18.49 1.03569 21.6 22.4 1,062 19.6 20.3 976 St. George, Hanover-square 17.34 1.10438 16.6 18.3 867 14.8 16.3 784 St. George-in-the-East 18.43 1.03907 29.2 30.3 1,436 28.2 29.3 1,409 St. George, Southwark 17.35 1.10375 25.7 28.4 1,346 25.4 28.0 1,346 St. Giles 17.27 1.10886 23.9 26.5 1,256 22.4 24.8 1,192 St. James 17.16 1.11597 18.9 21.1 1,000 17.6 19.6 942 St. Luke 17.72 1.08070 26.7 28.9 1,370 29.5 31.9 1,534 St. Martin-in-the-Fields 15.74 1.21665 21.2 25.8 1,223 18.4 22.4 1,077 St. Marylebone 17.82 1.07464 21.0 22.6 1,071 20.2 21.7 1,043 St. Olave 18.42 1.03963 23.6 24.5 1,161 26.5 27.6 1,327 St. Pancras 17.89 1.07043 20.5 21.9 1,038 20.0 21.4 1,029 St. Saviour 18.29 1.04702 25.6 26.8 1,270 26.5 27.7 1,332 Shoreditch 18.45 1.03794 22.9 23.8 1,128 23.4 24.3 1,168 Stoke Newington 17.85 1.07283 — — — 14.3 15.3 736 Strand 16.24 1.17919 25-0 29.5 1,398 23.7 27.9 1,342 Wandsworth 17.93 1.06804 — — —' 15.1 16.1 774 Westminster 16.94 1.13046 21.9 24.8 1,175 21.3 24.1 1,159 Whitechapel 17.74 1.07948 22.8 24.6 1,166 23.4 25.3 1,217 Woolwich 16.99 1.12713 20.5 23.1 1,095 18.2 20.5 986 The death rates of Battersea, Wandsworth, Hammersmith, Fulham, Stoke Newington, Hackney, Lee, and Plumstead cannot be given for the period 1885-94, as during some portion of this period Battersea was combined with Wandsworth, Hammersmith with Fulham, Stoke Newington with Hackney, and Lee with Plumstead; the death rates of the combined areas for this period, however, are shown in the following table— Sanitary area. Standard death rate. Factor for correction for age and sex distribution. Crude death rate, 1885-94. Corrected death rate, 1885-94. Comparative mortality figure, 1885-94. [London 1,000.] Wandsworth (combined with Battersea) 17.86 1.07223 16.5 17.7 839 Fulham (combined with Hammersmith) 18.15 1.05510 19.2 20.3 962 Hackney (combined with Stoke Newington) 18.23 1.05047 17.2 18.1 858 Plumstead (combined with Lee) 18.51 1.03458 15.0 15.5 735 The factors for correction in the above tables are calculated upon the age and sex distri bution of the population enumerated in the district at the time when the census of 1891 was taken. This 1 Including deaths of Londoners in the Metropolitan Workhouses, Hospitals, and Lunatic Asylum'*, situated outside Registration London, but excluding deaths of persons not belonging to London occurring in the Highgate Smallpox Hospital, in the London Fever Hospital, in the Middlesex County Lunatic Asylum at Wandsworth, and in the Metropolitan Asylums Board Hospitals within Registration London. 2 These death rates are fully corrected for institutions, i.e., by the exclusions of deaths of persons not belonging to but occurring in institutions situated within London, and by the inclusion of deaths of persons belonging to but occurring in institutions situated outside 3 All death rates in this report relating to London Sanitary Districts are fully corrected for institutions. (See footnote (2).)](https://iiif.wellcomecollection.org/image/b18252448_0018.jp2/full/800%2C/0/default.jpg)