[Report 1936] / Medical Officer of Health, Radnorshire County Council.
- Radnorshire (Wales). County Council.
- Date:
- 1936
Licence: Attribution 4.0 International (CC BY 4.0)
Credit: [Report 1936] / Medical Officer of Health, Radnorshire County Council. Source: Wellcome Collection.
16/84 page 14
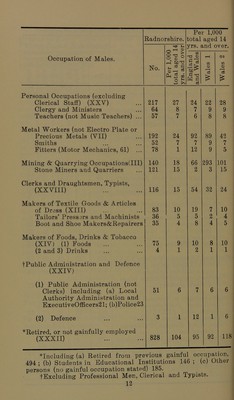
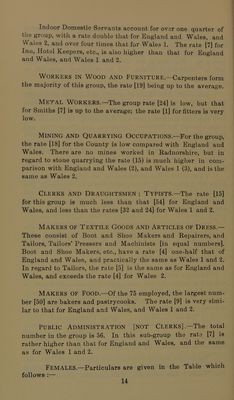
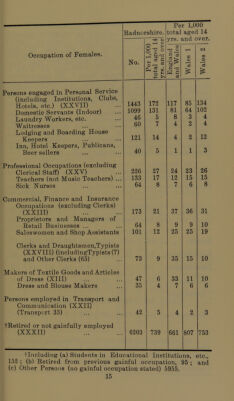
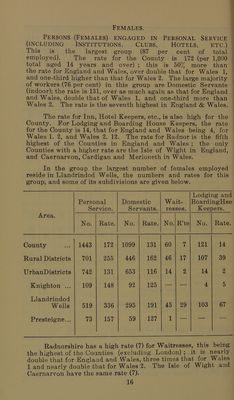
![Indoor Domestic Servants account for over one quarter of the group, with a rate double that for England and Wales, and Wales 2, and over four times that for Wales 1. The rate [7] for Inn, Hotel Keepers, etc., is also higher than that for England and Wales, and Wales 1 and 2. Workers in Wood and Furniture.—Carpenters form the majority of this group, the rate [19] being up to the average. METALWORKERS.—The group rate [24] is low, but that for Smiths [7] is up to the average; the rate [1] for fitters is very low. Mining and Quarrying Occupations.—For the group, the rate [18] for the County is low compared with England and Wales. There are no mines worked in Radnorshire, but in regard to stone quarrying the rate (15) is much higher in com- parison with England and Wales (2), and Wales 1 (3), and is the same as Wales 2. Clerks and Draughtsmen ; Typists.—The rate [15] for this group is much less than that [54] for England and Wales, and less than the rates [32 and 24] for Wales 1 and 2. Makers of Textile Goods and Articles of Dress.— These consist of Boot and Shoe Makers and Repairers, and Tailors, Tailors’ Pressers and Machinists [in equal numbers]. Boot and Shoe Makers, etc., have a rate [4] one-half that of England and Wales, and practically the same as Wales 1 and 2. In regard to Tailors, the rate [5] is the same as for England and Wales, and exceeds the rate [4] for Wales 2. Makers of Food.—Of the 75 employed, the largest num- ber [50] are bakers and pastrycooks. The rate [9] is very simi- lar to that for England and Wales, and Wales 1 and 2. Public Administration [not Clerks].—The total number in the group is 56. In this sub-group the rate [7] is rather higher than that for England and Wales, and the same as for Wales 1 and 2. Females.—Particulars are given in the Table which follows :—•](https://iiif.wellcomecollection.org/image/b28874900_0018.jp2/full/800%2C/0/default.jpg)

 No text description is available for this image
 No text description is available for this image
 No text description is available for this image