Genetics of resistance to bacterial and parasitic infection / edited by D. Wakelin and J.M. Blackwell.
- Date:
- 1988
Licence: Attribution-NonCommercial-NoDerivatives 4.0 International (CC BY-NC-ND 4.0)
Credit: Genetics of resistance to bacterial and parasitic infection / edited by D. Wakelin and J.M. Blackwell. Source: Wellcome Collection.
261/308 (page 247)
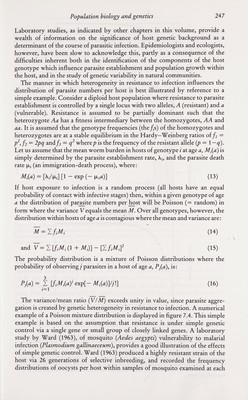
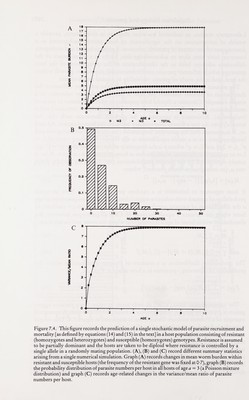
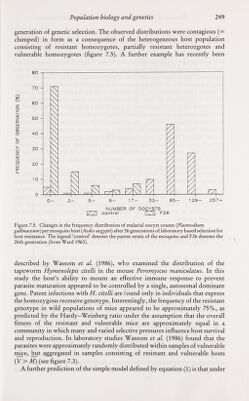
![Population biology and genetics 247 Laboratory studies, as indicated by other chapters in this volume, provide a wealth of information on the significance of host genetic background as a determinant of the course of parasitic infection. Epidemiologists and ecologists, however, have been slow to acknowledge this, partly as a consequence of the difficulties inherent both in the identification of the components of the host genotype which influence parasite establishment and population growth within the host, and in the study of genetic variability in natural communities. The manner in which heterogeneity in resistance to infection influences the distribution of parasite numbers per host is best illustrated by reference to a simple example. Consider a diploid host population where resistance to parasite establishment is controlled by a single locus with two alleles, A (resistant) and a (vulnerable). Resistance is assumed to be partially dominant such that the heterozygote Aa has a fitness intermediary between the homozygotes, AA and aa. It is assumed that the genotype frequencies (the/¿s) of the homozygotes and heterozygotes are at a stable equilibrium in the Hardy-Weinberg ratios oifi = p^,/2 = 2pq and/j = where p is the frequency of the resistant allele {p = 1 — ^). Let us assume that the mean worm burden in hosts of genotype i at age a, M ¿{a) is simply determined by the parasite establishment rate, and the parasite death rate |JL¿ (an immigration-death process), where: Mi{a) = [Xi/p.,] [1 - exp (- [lia)] (13) If host exposure to infection is a random process (all hosts have an equal probability of contact with infective stages) then, within a given genotype of age a the distribution of parasite numbers per ^st will be Poisson (= random) in form where the variance V equals the mean M. Over all genotypes, however, the distribution within hosts of age a is contagious where the mean and variance are: M = (14) and V = I {fiM, (1 + Л/,.)] - [IfiMi]' (15) The probability distribution is a mixture of Poisson distributions where the probability of observing; parasites in a host of age a, P¡{a), is: Pj{a) = i [f.Miay exp[- ^.(й)]/;!] (16) i=\ The variance/mean ratio {V/M) exceeds unity in value, since parasite aggre¬ gation is created by genetic heterogeneity in resistance to infection. A numerical example of a Poisson mixture distribution is displayed in figure 7.4. This simple example is based on the assumption that resistance is under simple genetic control via a single gene or small group of closely linked genes. A laboratory study by Ward (1963), of mosquito {Aedes aegypti) vulnerability to malarial infection {Plasmodium gallinaeceum), provides a good illustration of the effects of simple genetic control. Ward (1963) produced a highly resistant strain of the host via 26 generations of selective inbreeding, and recorded the frequency distributions of oocysts per host within samples of mosquito examined at each](https://iiif.wellcomecollection.org/image/b18032151_0262.JP2/full/800%2C/0/default.jpg)