Genetics of resistance to bacterial and parasitic infection / edited by D. Wakelin and J.M. Blackwell.
- Date:
- 1988
Licence: Attribution-NonCommercial-NoDerivatives 4.0 International (CC BY-NC-ND 4.0)
Credit: Genetics of resistance to bacterial and parasitic infection / edited by D. Wakelin and J.M. Blackwell. Source: Wellcome Collection.
262/308 (page 248)
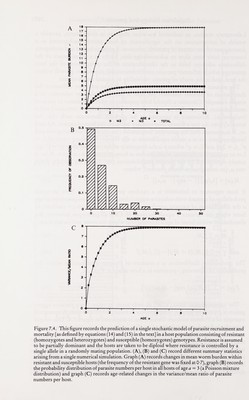
![в I ь ìi s TOTAL I Г77\ 10 20 30 NUMBER OF PARASnrS 40 —Г- 50 AGE a Figure 7.4. This figure records the prediction of a single stochastic model of parasite recruitment and mortality [as defined by equations (14) and ( 15) in the text] in a host population consisting of resistant (homozygotes and heterozygotes) and susceptible (homozygotes) genotypes. Resistance is assumed to be partially dominant and the hosts are taken to be diploid where resistance is controlled by a single allele in a randomly mating population. (A), (B) and (C) record different summary statistics arising from a single numerical simulation. Graph (A) records changes in mean worm burden within resistant and susceptible hosts (the frequency of the resistant gene was fixed at 0-7), graph (B) records the probability distribution of parasite numbers per host in all hosts of age d = 3 (a Poisson mixture distribution) and graph (C) records age-related changes in the variance/mean ratio of parasite numbers per host.](https://iiif.wellcomecollection.org/image/b18032151_0263.JP2/full/800%2C/0/default.jpg)