[Report of the Medical Officer of Health for Dagenham].
- Dagenham (London, England). Urban District Council.
- Date:
- [1928]
Licence: Attribution-NonCommercial 4.0 International (CC BY-NC 4.0)
Credit: [Report of the Medical Officer of Health for Dagenham]. Source: Wellcome Collection.
18/56 page 12
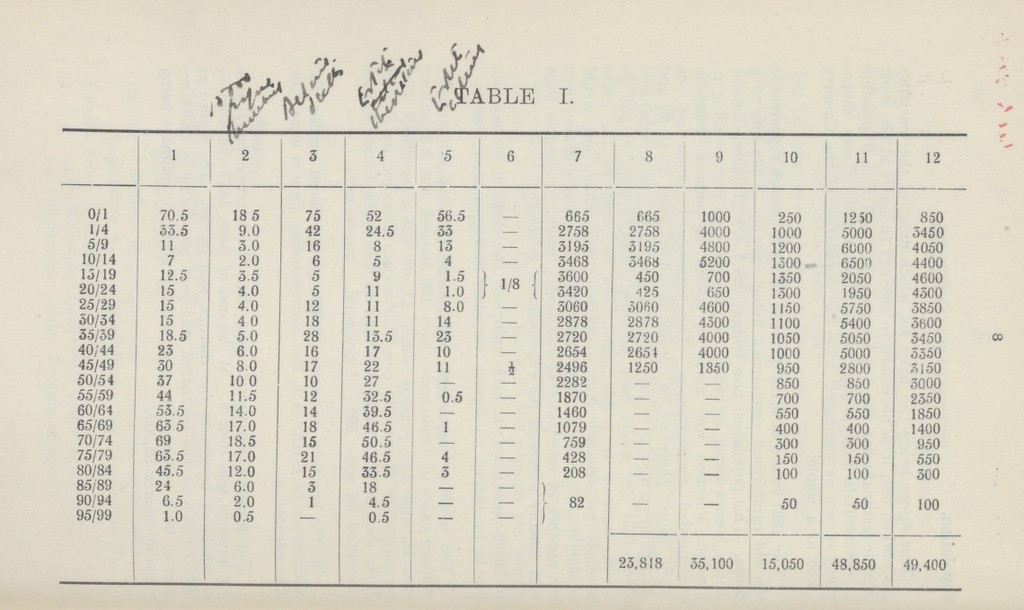
![12 Death Rate. Total deaths in district 248 Transfers out of district 75 Inward transfers 176 Deaths of residents 349 349 deaths in a population of 50,000 represents a death rate of 7.0 per 1,000. The death rate for England and Wales for 1927 was 12.3. The crude death rate is the actual number of deaths occurring in the district per 1,000 population. For comparative purposes it is not used] as it is too much affected by the questions of institutions, e.g., hospitals and sanatoria in the area. For this area for instance, there is the Dagenham Sanatorium for West Ham. The deaths occurring at this in stitution should not be included in the local returns. Con versely many deaths occur amongst Dagenham residents in various institutions outside the area. The recorded death rate allows for these deaths of non parishioners occurring in this area and for the deaths of local residents occurring outside the district. This death rate gives, for a stationary population, a rough index for comparison of one district with another. It is however affected by:— 1. The Sex Distribution of the Population:- At most ages the death rate for males exceeds that of females. If therefore the normal distribution of males and females is disturbed there will be some corresponding alteration in these figures. 2. The Age Distribution:—If for any reason the distribution of age groups is abnormal this change will be reflected in the death rate, e.g., if in a given population there is some undue preponderance of aged people there will be more deaths per 1,000 of the general population; that is, the death rate will be higher. The age distribution is subject to the control of two factors; firstly the rate of increase of population and secondly the mode of such increase. If the birth rate exceeds the death rale it means a preponderance of distribution in the lower age groups, i.e., at those age groups which have the lowest death rate. In such a case therefore the death rate would be lower than the average. Similarly the immigration of children and young adults would have a like effect. In stable communities these alterations in age and sex dis tribution can be allowed for by means of a Correction Factor and the Corrected Death Rate can be obtained. This figure is used as the index of healthiness for comparison of one district with another. To obtain this however for the area, would require](https://iiif.wellcomecollection.org/image/b19787327_0018.jp2/full/800%2C/0/default.jpg)