Blood : a study in general physiology / by Lawrence J. Henderson.
- Lawrence Joseph Henderson
- Date:
- 1928
Licence: In copyright
Credit: Blood : a study in general physiology / by Lawrence J. Henderson. Source: Wellcome Collection.
155/434 page 129
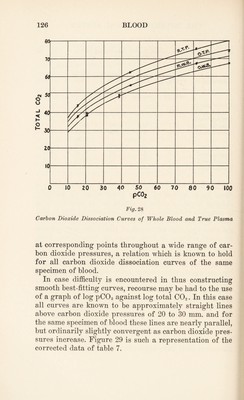
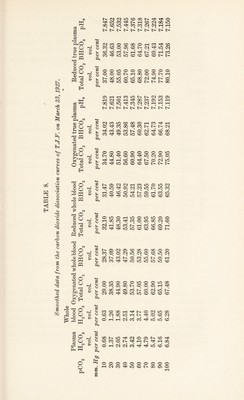
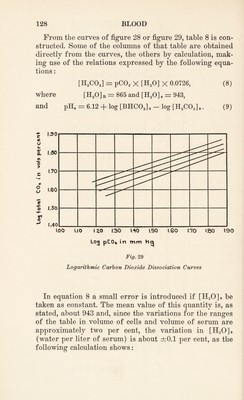
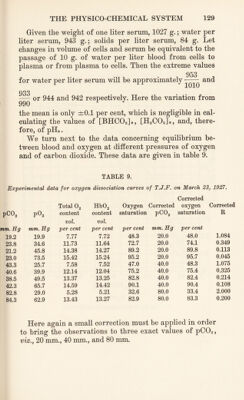
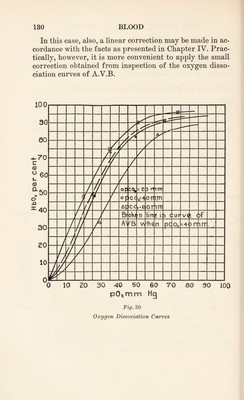
![Given the weight of one liter serum, 1027 g.; water per liter serum, 943 g.; solids per liter serum, 84 g. Let changes in volume of cells and serum be equivalent to the passage of 10 g. of water per liter blood from cells to plasma or from plasma to cells. Then the extreme values for water per liter serum will be approximately 953 1010 and 933 990 or 944 and 942 respectively. Here the variation from the mean is only ±0.1 per cent, which is negligible in cal¬ culating the values of [BHC03]8, [H2C03]s, and, there¬ fore, of pHs. We turn next to the data concerning equilibrium be¬ tween blood and oxygen at different pressures of oxygen and of carbon dioxide. These data are given in table 9. TABLE 9. Experimental data for oxygen dissociation curves of T.J.F. on March 23, 1927. Pco2 p02 Total 02 content Hb02 content Oxygen saturation Corrected pC02 Corrected oxygen saturation Corrected R mm. Eg mm. Eg vol. per cent vol. per cent per cent mm. Eg per cent 19.2 19.9 7.77 7.72 48.3 20.0 48.0 1.084 23.8 34.6 11.73 11.64 72.7 20.0 74.1 0.349 21.2 45.8 14.38 14.27 89.2 20.0 89.8 0.113 23.0 73.5 15.42 15.24 95.2 20.0 95.7 0.045 43.3 25.7 7.58 7.52 47.0 40.0 48.3 1.075 40.6 39.9 12.14 12.04 75.2 40.0 75.4 0.325 38.5 49.5 13.37 13.25 82.8 40.0 82.4 0.214 42.3 65.7 14.59 14.42 90.1 40.0 90.4 0.108 82.8 29.0 5.28 5.21 32.6 80.0 33.4 2.000 84.3 62.9 13.43 13.27 82.9 80.0 83.3 0.200 Here again a small correction must be applied in order to bring the observations to three exact values of pC02, viz., 20 mm., 40 mm., and 80 mm.](https://iiif.wellcomecollection.org/image/b29928771_0155.jp2/full/800%2C/0/default.jpg)

 No text description is available for this image
 No text description is available for this image
 No text description is available for this image