Census 1961, England and Wales : Commonwealth immigrants in the conurbations.
- General Register Office Northern Ireland
- Date:
- 1965
Licence: Public Domain Mark
Credit: Census 1961, England and Wales : Commonwealth immigrants in the conurbations. Source: Wellcome Collection.
13/144
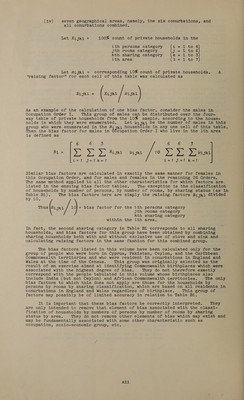
![For an example of how this information can be used there were 1,69 male carpenters and joiners (occupation 080) born in Jamaica in the sample. The odds are therefore 20 to 1 that the number in the whole population lies in the range (169 2 x13) x 10 1.e. in the range of 1,430 to 1,950. It is important to remember that all such calculations should be made using the actual sample number and not the estimate obtained by grossing-up the sample. These estimates of sampling error have been obtained by assuming that the sample is equivalent to a random sample of persons. It is assumed that the tendency for the sampling error to be-increased by the effect of clustering with the use of a sample of households is offset by the high degree of stratification involved in a systematic sample which ensures that one in ten households has been selected evenly throughout the country. Bias After the 1961 Census, the 10% sample was checked for bias by comparing certain items of information common to the full census and the sample census. One such comparison showed clearly that the sample of households was biased. Although the total number of households in the sample is almost exactly one»tenth of the total in the whole country, the distribution of households by number of persons and number of rooms occupied is distorted. The amount of bias is shown in the table below. Percentage Excess in 10% sample when compared with one tenth of the full count figures Number of rooms occupied Persons in 9 All the Household 4. 2 a4 5 e and households OV eT 7-8 ae -—11 }) -14 -8 =i eA +10 -8 2—6 ~7 -3 +0 +1} +5 | +9 +20 +2 7 and over =-22 | -28'| -14] =10] -9 | -7 -1 -10 All households } -10 +3 +17 +0 There is considerable under-representation of one person households and of large households. For any stated size of household there is a clear gradient from too few households occupying few rooms towards too many households with large numbers of rooms. To allow for this bias, correcting factors have been calculated which users can apply to the 10% census data. It was not a practical proposition to, calcu- late such factors for every entry in the tables. Instead they have been obtained for certain of the more important marginal totals. For example, a bias factor has been calculated for each of the 27 Occupation Orders defined in Classification of Occupations, 1960 (H.M.S.0O. 1960). These bias factors are used by multiplying them into the appropriate Census figure to give a new figure corrected for bias. Thus a bias factor of 0*98000 denotes that the published Census estimate is too high by 2%. A-brief description of the method of calculation of these factors is as follows. The 100% Census count of private households and the 10% Census sample count of private households were each (separately) distributed over a four-way table whose axes were, (4) six categories of the number of persons in the household, CHIRP SH 4795 PNG \ortnioré) (ii) six categories of the number of rooms occupied, (2, U2OSSL0 Sywe-7 pyeror: more) (i111) three categories of sharing status, namely, non-sharing, sharing with exclusive use of stove and sink, sharing without exclusive use of stove and sink. Sel](https://iiif.wellcomecollection.org/image/b32183306_0013.jp2/full/800%2C/0/default.jpg)