[Report 1948] / Medical Officer of Health, Essex County Council.
- Essex County Council
- Date:
- 1948
Licence: Attribution 4.0 International (CC BY 4.0)
Credit: [Report 1948] / Medical Officer of Health, Essex County Council. Source: Wellcome Collection.
8/172 page 8
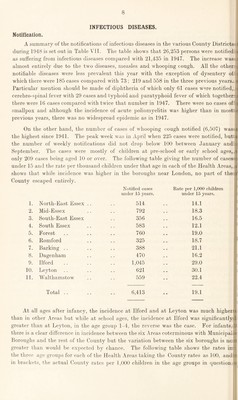
![Notification. INFECTIOUS DISEASES. A summary of the notifications of infectious diseases in the various County Districts i during 1948 is set out in Table VII. The table shows that 26,253 persons were notified hi as suffering from infectious diseases compared with 21,435 in 1947. The increase was- £ almost entirely due to the two diseases, measles and whooping cough. All the other:li notifiable diseases were less prevalent this year with the exception of dysentery of in which there were 185 cases compared with 73 ; 219 and 558 in the three previous years, ir Particular mention should be made of diphtheria of which only 61 cases were notified, cerebro-spinal fever with 29 cases and typhoid and paratyphoid fever of which together! 3 there were 16 cases compared with twice that number in 1947. There were no cases of ] smallpox and although the incidence of acute poliomyelitis was higher than in mosttf previous years, there was no widespread epidemic as in 1947. On the other hand, the number of cases of whooping cough notified (6,507) wassl the highest since 1941. The peak week was in April when 225 cases were notified, butiit the number of weekly notifications did not drop below 100 between January andioj September. The cases were mostly of children at pre-school or early school ages, js only 209 cases being aged 10 or over. The following table giving the number of casest under 15 and the rate per thousand children under that age in each of the Health Areas, shows that while incidence was higher in the boroughs near London, no part of the? County escaped entirely. Notified cases Rate per 1,000 children under 15 years. under 15 years. 1. North-East Essex .. 514 14.1 2. Mid-Essex 792 18.3 3. South-East Essex 356 16.5 4. South Essex 583 12.1 5. Forest 760 19.0 6. Romford 325 18.7 7. Barking . . 388 21.1 8. Dagenham 470 16.2 9. Ilford 1,045 29.0 10. Leyton 621 30.1 11. Walthamstow 559 22.4 Total 6,413 19.1 At all ages after infancy, the incidence at Ilford and at Leyton was much higher h than in other Areas but while at school ages, the incidence at Ilford was significantly^ greater than at Leyton, in the age group 1-4, the reverse was the case. For infants, there is a clear difference in incidence between the six Areas coterminous with Municipal Boroughs and the rest of the County but the variation between the six boroughs is noc greater than would be expected by chance. The following table shows the rates iuiii the three age groups for each of the Health Areas taking the County rates as 100, and in brackets, the actual County rates per 1,000 children in the age groups in question,!](https://iiif.wellcomecollection.org/image/b29196048_0010.jp2/full/800%2C/0/default.jpg)