[Report 1970] / Medical Officer of Health, Bognor Regis U.D.C.
- Bognor Regis (England). Urban District Council.
- Date:
- 1970
Licence: Attribution 4.0 International (CC BY 4.0)
Credit: [Report 1970] / Medical Officer of Health, Bognor Regis U.D.C. Source: Wellcome Collection.
13/50 page 11
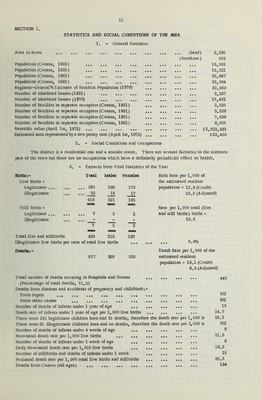
![SECTION 1. STATISTICS AND SOCIAL CONDITIONS OF THE AREA 1. - General Statistics Area in acres ... ... ... ... ... ... • • • • • • • • • (land) 2,695 (foreshore) 352 Population (Census, 1921) • • • • • • • • • • • • 13,302 Population (Census, 1931) • • • • • • • • • • • • 13,521 Population (Census, 1951) • • • • • • • • • • • • 25,647 Population (Census, 1961) • • • • • • • • • • • • 28,064 Registrar-General's Estimate of Resident Population (1970) • • • • • • e • • • • • 32,360 Number of inhabited houses (1921) © • • • • • • • • • • • 2,237 Number of inhabited houses (1970) • • • • • • • • © • • • 13,481 Number of families or separate occupiers (Census, 1921) • • • • • • • © • • • • 2,525 Number of families or separate occupiers (Census, 1931) • • • • • • • • • • • • 3,239 Number of families or separate occupiers (Census, 1951) • • • • • • « • • • • • 7,839 Number of families or separate occupiers (Census, 1961) • • • • • • • • © • • • 9,801 Rateable value (April 1st, 1971) • • • • © • • • • • • • £2,322,431 Estimated sum represented by a new penny rate (April 1st, 1971) • • • • • • • • • • • • £22,400 2. - Social Conditions and Occupations The district is a residential one and a seaside resort. There are several factories in the northern part of the town but there are no occupations which have a definitely prejudicial effect on health. 3. - Extracts from Vital Statistics of the Year Births:- Total Males Live Births - Legitimate ... 381 203 Illegitimate ... 35 18 416 221 SSSS Still Births - Legitimate ... 7 5 Illegitimate ... • • • - 7 5 •mmm memm Total live and stillbirths 423 226 Illegitimate live births per cent of total live births Deaths:- 617 289 Females Birth Rate per 1,000 of the estimated resident 178 population - 12.9 (Crude) 17 195 20.3 (Adjusted) BS- Rate per 1,000 total (live 2 and still births) births - ~~2 197 16.6 • • © ... ... 8.4°]o Death Rate per 1, 000 of the 328 estimated resident population - 19.1 (Crude) 9.0 (Adjusted) Total number of deaths occuring in Hospitals and Homes ... (Percentage of total deaths, 71.3) Deaths from diseases and accidents of pregnancy and childbirth From Sepsis .«• ••• .. • • • • ••• • • • • • • From other causes •«. «.. .«. ... • • • «.. Number of deaths of infants under 1 year of age Death rate of infants under 1 year of age per 1,000 live births ... There were 381 legitimate children born and 10 deaths, therefore the There were 35 illegitimate children born and no deaths, therefore the Number of deaths of infants under 4 weeks of age ... Neo-natal death rate per 1,000 live births Number of deaths of infants under 1 week of age ... Early Neo-natal death rate per 1,000 live births ... Number of stillbirths and deaths of infants under 1 week Perinatal death rate per 1, 000 total live births and stillbirths Deaths from Cancer (all ages) death death rate per rate per 1,000 is 1,000 is 440 Nil Nil 10 24.0 26.2 Nil 9 21.6 8 19.2 15 35.5 134](https://iiif.wellcomecollection.org/image/b28937417_0013.jp2/full/800%2C/0/default.jpg)