[Report 1957] / Medical Officer of Health, Leatherhead U.D.C.
- Leatherhead (England). Urban District Council.
- Date:
- 1957
Licence: Attribution 4.0 International (CC BY 4.0)
Credit: [Report 1957] / Medical Officer of Health, Leatherhead U.D.C. Source: Wellcome Collection.
11/82 page 5
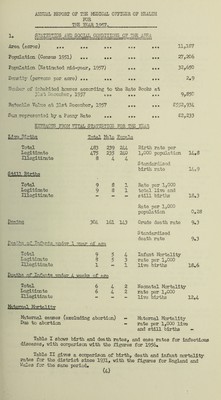
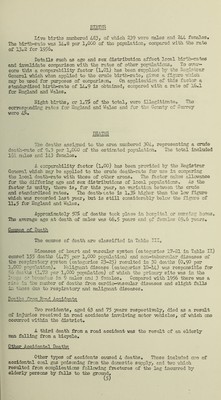
![BIRTHS Live births numbered 423, of which 239 were males and 244 females* The birth-rate was 14.8 per 1,000 of the population, compared with the rate of 13o2 for 1936* Details such as age and sex distribution affect local birth-rates and invalidate comparison with the rates of other populations0 To over¬ come this a comparability factor (l.Ol) has been supplied by the Registrar General which when applied to the crude birth-rate, gives a figure which may be used for purposes of comparison. On application of this factor a standardised birth-rate of 14.9 is obtained, compared with a rate of 16,1 for England and Wales, Eight births, or 1.7$ of the total, were illegitimate© The corresponding rates for England and Wales and for the Gcunty of Surrey were 4$<> DEATHS The deaths assigned to the area numbered 304, representing a crude death-rate of 9.3 per 1,000 of the estimated population. The total included l6l miles and 143 females, A comparability factor (l.OO) has been provided by the Registrar General which may be applied to the crude death-rate for use in comparing the local death-rate with those of other areas. The factor males allowance for the differing age and sex distributions of local populations. As the factor is unity, there is, for this year, no variation between the crude and standardised rates. The death--lata is 1,3$ higher than the low figure which was recorded last year, but is still considerably below the figure of 11,5 for England and Wales. Approximately 50$ of deaths took place in hospital or nursfrg homos. The average age at death of males was 66,5 years and of females 69,6 years. Causes of Death The causes of death are classified in Table III. Diseases of heart and vascular system (categories 17-21 in Tablo II) caused 155 deaths (4.75 per 1,000 population) and non-tubercular diseases of the respiratory system (categories 23-25) resulted in 30 deaths (0,90 per 1,000 population)„ Malignant disease (categories 10-14) was responsible for 56 deaths (l„7?. per 1,000 population) of which the primary site was in the ] ago or bronchus in 9 males and 3 females. Compared with 1956 there was a rise in the number of deaths from cardio-vascular diseases and slight falls in those due to respiratory and malignant diseases. Deathfrom F-ui.d Accidents Two residents, aged 63 and 75 years respectively, died as a result of injuries received in road accidents involving motor vehicles, of which one occurred within the district. A third death from a road accident was the result of an elderly man falling from a bicycle. Other types of accidents caused 4 deaths. These included one of accidental coal gas poisoning from the domestic supply, and two which resulted from complications following fractures of the leg incurred by elderly persons by falls to the ground. (5)](https://iiif.wellcomecollection.org/image/b29721386_0011.jp2/full/800%2C/0/default.jpg)


 No text description is available for this image
 No text description is available for this image
 No text description is available for this image