Volume 1
Principles and practice of medical genetics / editors, Alan E.H. Emery, David L. Rimoin ; assistant editor, Jeffrey A. Sofaer ; editorial assistant, A.P. Garber ; foreword by Victor A. McKusick.
- Date:
- 1983
Licence: Attribution-NonCommercial 4.0 International (CC BY-NC 4.0)
Credit: Principles and practice of medical genetics / editors, Alan E.H. Emery, David L. Rimoin ; assistant editor, Jeffrey A. Sofaer ; editorial assistant, A.P. Garber ; foreword by Victor A. McKusick. Source: Wellcome Collection.
146/784 (page 118)
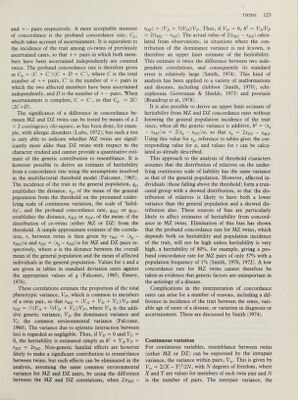
![FREQUENCY joint probability of the child and parents’ phenotypes are given in Table 10.8 for p. = 0 and d = 1 Table 10.8 0 c 1 2 0 P 3 p 2 ? 0 F 1 p 2 q pq pq 2 2 0 pq ? 3 The elements of the table were computed assuming Har dy-Weinberg equilibrium, Mendelian segregation, and random mating. Each element corresponds to the joint probability of the relevant child and parent phenotypes, so the probability that the parent’s phenotype is 1 and the child’s phenotype is 2 is pq 2 . Each probability is computed by considering all the possible genotypes for the other parent. Let /^X] denote the probability of the event X, then the marginal distributions are given by P[C = 0] = P[F = 0 )=p 2 P[C - 1] = P[F = 1] = 2pq P[C = 2] = P[F = 2] = q 2 Further, the mean or expected values of C and F are given by E[C] = E[F] = 2 q, the variance of C and F by var[C] = var[F] = 2 pq, and the covariance of C and F by cov[C,F] = pq. The correlation, p PO , between parent and offspring is given by cov[C,F] pq ^ po V var[C]var[F] V(2 pq) (2 pq) 1 The result is interesting because it is independent of the allele frequency. A similar argument can be used to show that the correlation between sibs p ss is also Be cause of our additive assumptions, the correlation repre sents the proportion of genes the individuals share. The above result applies to each of n loci, each of which has two alleles (a„ A, at the ith locus). The fre quency of a, is pi and that of A, is q, (q t = 1 - p,). Again the effect of A, is 1 for the ith locus. F, is the genotypic effect at the ith locus. If each of the loci affects the same phenotype in an additive and equal fashion, then F = F ] + F 2 + . . . + F n and C = Ci + C 2 + . . . + C n where again F is the phenotype of the parent and C is the phenotype of the child. Further, if the loci are segre gating independently of each other, then var{F ) = var(Fi) + var(F 2 ) + ....+ var{F n ) = 2 p x q\ + 2 p 2 q 2 +....+ 2 p n q n var(C ) = var(Ci) + var(C 2 ) + ....+ var(C„) cov(F,C) = cov(F\,C\) + cov(F 2 ,C 2 ) + ....+ cov(F n , C n ) - P\<i\ + P 2 Ç 2 +....+ p n q n and ppo = h Pss = i With one locus, there were only 3 phenotypes; with two loci there are 5, and in general with n loci, there are 2n+l phenotypes. Notice, however, that in general there are many different genotype combinations that lead to the same phenotype. PHENOTYPE PHENOTYPE PHENOTYPE Fig. 10.2 Distribution of population types for one (A) two (B) and ten (C) loci.](https://iiif.wellcomecollection.org/image/b18037446_vol_1_0147.JP2/full/800%2C/0/default.jpg)