[Report 1946] / Medical Officer of Health, Cockermouth U.D.C.
- Cockermouth (England). Urban District Council.
- Date:
- 1946
Licence: Attribution 4.0 International (CC BY 4.0)
Credit: [Report 1946] / Medical Officer of Health, Cockermouth U.D.C. Source: Wellcome Collection.
11/24 page 9
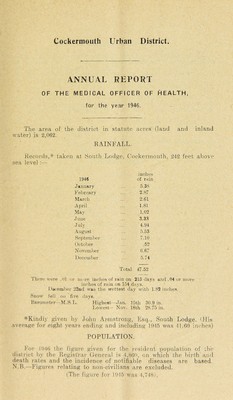
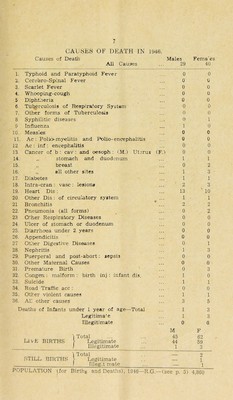
![d INQUESTS, UNCERTIFIED DEATHS AND VIOLENCE. In respect of deaths belonging to the district dui’ing the year there were 4 inquests and these were held within the district. One Coroner’s certificate was re.;ei\ ed in respect of a case where post-mortem examination has been made but no inquest held. Three deaths were uncertified. Violence.—The death mte due to Violence (All Forms) was nil per 1000 of the poiDulation in the Cockermouth Urban District. Below will be. seen the number of deaths from Suicide, Road Traffic Accident, Other Violence and the Total Violence deaths, together with the percentages of the total deaths from all causes, and the death rates of each per 1,000 of the population in comparison with 1945.— Other Violence Hoad Tratiic excl’g Rnad Total Snicido Accident Traffic .Acc. Vio'ence 1946 1945 1946 1945 1946 1945 1946 1 1945 Deaths 2 nil nil ml 2 nil ' 4 nil “io of all causes 2.8 nil nil nil 2.8 nil • 5-7 nil D.R. per 1000 .41 nil ’ nil nil .41 nil .82 nil popln. The four violence deaths during the year incl Lide 2 due suicide (1 by hanging ami 1 cut-throat) and 2 mui •dei' (straiupi lation). CANCER. Cancer proved fatal in 8 cases, as follows ; — S\-.stem Primary Organ Males P emalos Ycar.s old Alimentary Stomach 1 1 67 07 Colon 2 hi 65 Glandular Breast 2 47 7S Ovary 1 57 Multiple Metastases (primary site unknown) ' 57 This nuimber corresponds to a cancer death rate of 1.6 per 1,000 of the po]Hijation as compared with 2.3 in 19^5. Approximately out of eveiw 9 deaths of persons in this distiict i was attributed to cancer. (1945—I in 5). TUBERCULOSIS. Vide also page 17. There were no deaths due to Tnbercuiosis, i.e.— Males. Female. Respiratory System o o Non-Pulmonary o o The Tuberculosis fall forms) death rate, therefore, was ni] j.ei- 1,000 of the poiuiiation, as compared with fotn- deaths and a i-aU' of .31 for 1945. The ‘'Consumption” (i.e. Pulmonary Tubcrculr)sis) Death rat* was also nil per 1,000 of the population, as (U)nipared with last year's figure of .81 (four fh’aths).](https://iiif.wellcomecollection.org/image/b29118268_0011.jp2/full/800%2C/0/default.jpg)


 No text description is available for this image
 No text description is available for this image
 No text description is available for this image