[Report 1937] / Medical Officer of Health, Cambridge Borough.
- Cambridge (England). Borough Council.
- Date:
- 1937
Licence: Attribution 4.0 International (CC BY 4.0)
Credit: [Report 1937] / Medical Officer of Health, Cambridge Borough. Source: Wellcome Collection.
9/84 page 7
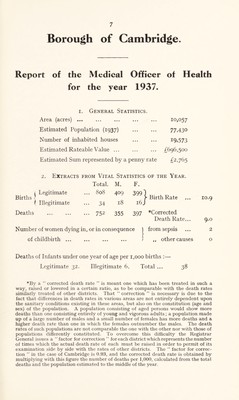
![Borough of Cambridge. Report of the for Medical Officer of Health the year 1937. I. General Statistics. Area (acres) ... Estimated Population (1937) Number of inhabited houses Estimated Rateable Value ... Estimated Sum represented by a penny rate 10,057 77>430 I9»573 £696,500 £2,765 2. Extracts from Vital Statistics of the Year. Total. M. F. ( Legitimate Births ... 808 409 399] ► Birth Rate 10.9 ( Illegitimate 34 18 16 J Deaths ••• 752 355 397 ♦Corrected Death Rate... 9.0 Number of women dying in, or in consequence ) from sepsis 2 of childbirth ... « • • • • • • • • ) ,, other causes 0 Deaths of Infants under one year of age per 1,000 births :— Legitimate 32. Illegitimate 6. Total ... 38 *By a “ corrected death rate ” is meant one which has been treated in such a way, raised or lowered in a certain ratio, as to be comparable with the death rates similarly treated of other districts. That “ correction is necessary is due to the fact that differences in death rates in various areas are not entirely dependent upon the sanitary conditions existing in these areas, but also on the constitution (age and sex) of the population. A population consisting of aged persons would show more deaths than one consisting entirely of young and vigorous adults; a population made up of a large number of males and a small number of females has more deaths and a higher death rate than one in which the females outnumber the males. The death rates of such populations are not comparable the one with the other nor with those of populations differently constituted. To overcome this difficulty the Registrar General issues a “factor for correction for each district which represents the number of times which the actual death rate of each must be raised in order to permit of its examination side by side with the rates of other districts. The “ factor for correc- tion in the case of Cambridge is 0.93, and the corrected death rate is obtained by multiplying with this figure the number of deaths per 1,000, calculated from the total deaths and the population estimated to the middle of the year.](https://iiif.wellcomecollection.org/image/b29355795_0009.jp2/full/800%2C/0/default.jpg)