Industrial and personal hygiene / by George M. Kober. A report of the committee on social betterment.
- Kober, George M. (George Martin), 1850-1931
- Date:
- 1908
Licence: In copyright
Credit: Industrial and personal hygiene / by George M. Kober. A report of the committee on social betterment. Source: Wellcome Collection.
Provider: This material has been provided by London School of Hygiene & Tropical Medicine Library & Archives Service. The original may be consulted at London School of Hygiene & Tropical Medicine Library & Archives Service.
64/186 page 60
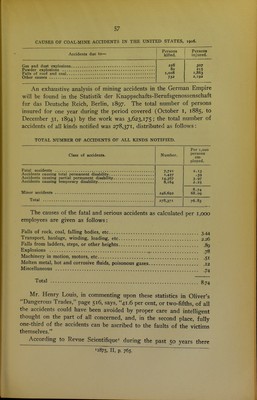
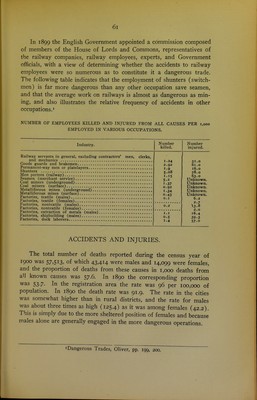
![RAILWAY ACCIDENTS. The reports' of the Interstate Commerce Commission indicate a constant increase in the number of injuries from railway accidents. The number of employees killed by accidents arising from the move- ment of trains, locomotives, or cars, as distinct from those of other causes, in 1906, was 3,709, of whom 2,310 were trainmen, and 42,962 injured, of whom 34,989 were trainmen. The number of fatalities to trainmen in this class of accidents is nearly equally distributed among collisions, falling from trains, locomotives, or cars, and being struck by trains, locomotives, or cars. When all classes of employees are taken into account the last-named cause is responsible for the greatest number of fatalities. Of the fatalities to passengers, collisions account for more than any other single cause, although the number due to jumping on or off trains, locomotives, or cars is nearly as great. In the matter of injuries, however, collisions are far ahead, being responsible for more than 35 per cent of the total injuries to passengers. Taking both pas- sengers and employees into account, it is seen that collisions are re- sponsible for a much higher number of deaths and injuries than any other one class of accidents.^ RAILWAY ACCIDENTS FOR THE YEARS 1888 TO 1906. [Fom the Nineteenth Annual Report of the Interstate Commerce Commission on the Statistics of Railways in the United States, page 109.] Year ending June 30— Employees. Killed. Injured Passengers. Killed. Injured. Other persons. Killed. Injured. Total. Killed. 1888 1889 1890 1891 1892 1893 1894 189s 1896 1897 1898 1899 1900 1901 1902 J 903 1904 190S 1906 2,070 1,972 2,451 2,660 2.554 2,727 1,823 1,811 1,861 1.693 1,958 2,210 2.550 2.675 2,969 3,606 3,632 3,361 3,929 20,148 20,028 22,396 26,140 28,267 31,729 23,422 25,696 29,696 27.667 31.761 34.923 39,643 41,142 50,524 60,481 67,067 66,833 76,701 315 310 286 293 376 299 324 170 181 222 221 239 249 282 345 355 441 537 359 2,138 2,146 2,425 2,972 3,229 3,034 2,375 2,873 2,795 2,945 3,442 4,128 4,988 6,683 8,231 9,111 10,457 10,764 2,897 3.541 3,598 4,076 4.217 4,320 4,300 4,155 4,406 4,522 4,680 4,674 5,066 5,498 5,274 5,879 5,973 5,805 6,330 3,602 4,135 4,206 4,769 5,158 5,435 5,433 5,677 5,845 6,269 6,176 6,25s 6,549 7,209 7,455 7,841 7,977 8,718 10,241 5,282 5.823 6,335 7,029 7,147 7,346 6,447 6,136 6,448 6,437 6,859 7.123 7.86s 8,455 8,588 9.840 10,046 9,703 10,618 iText of the 19th Annual Report on the Statistics of Railroads in the United States for the year ending June 30, 1906. 2Nineteenth Annual Report of the Interstate Commerce Commission on the Statistics of Railways in the United States, p. 112.](https://iiif.wellcomecollection.org/image/b21359568_0064.jp2/full/800%2C/0/default.jpg)
 No text description is available for this image
 No text description is available for this image
 No text description is available for this image