Report of the Director of Medical and Sanitary Services / [Ceylon].
- Ceylon. Civil Medical Department
- Date:
- [1927]
Licence: Public Domain Mark
Credit: Report of the Director of Medical and Sanitary Services / [Ceylon]. Source: Wellcome Collection.
62/138 (page 60)
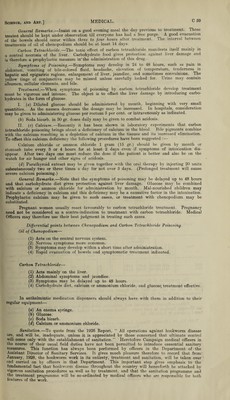
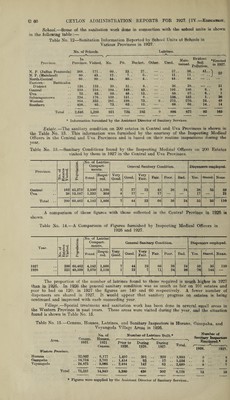
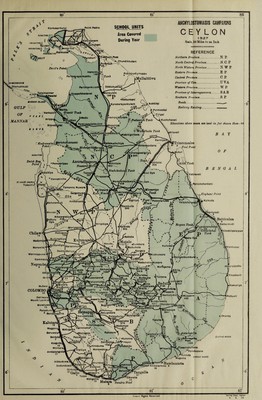
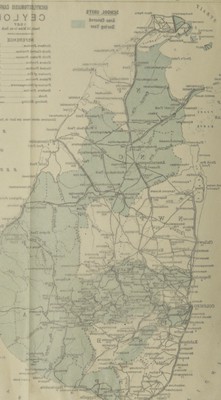
![School.—Some of the sanitation work done in connection with the school units is shown in the following table: — Table No. 12—Sanitation Information Reported by School Units at Schools in Various Provinces in 1927. No. of Schools. Latrines. r A r- V Province. In Province. Visited. No. Pit. Bucket. Other. Used. Main¬ tained. Evident Soil Pollution. *Erected in 1927. N. P. (Jaffna Peninsula) 368. . 171. . 60.. 33.. 27.. — . 57. 56 41.. ] 22 N. P. (Mainland) 80. . 43.. 12.. 7.. 5.. — . 11. 11 . - . . North-Central Eastern: Batticaloa 66. . 80. . 44. . 40.. 4.. — . 44. 44 * * * District 138. . 123.. 39. . 31. . 8.. — . 36. 39 . ■—- .. 31 Central 318. . 216. . 194.. 149 . . 45.. — . 191. 180 6.. 9 Uva . . 72. . 63. . 59.. 48. . 11.. — . 58. 57 6.. 1 Sabaragamuwa 234. . 176.. 159. . 151. . 8.. — . 156. 152 1.. 36 Western 954. . 332. . 281. . 199. . 73.. 9. 275. 270 24.. 49 Southern 416. . 85.. 73. . 62. . 11.. — . 68. 68 14.. 14 Total 2,646 1,289 921 72Q 192 9 896 877 92 162 * Information furnished by the Assistant Director of Sanitary Services. Estate.—The sanitary condition on 200 estates in Central and Uva Provinces is shown in the Table No. 13. This information was furnished by the courtesy of the Inspecting Medical Officers in the Central and Uva Provinces and is based on their routine inspections during the year. Table No. 13.—Sanitary Conditions found by the Inspecting Medical Officers on 200 Estates visited by them in 1927 in the Central and Uva Provinces. Province. No. of Estates Visited. Population. No. of Latrine Compart¬ ments. General Sanitary Condition. Dispensers employed. Found. Requi - red. Very Good. Good. Very Fair. Fair. Poor. Bad. Yes. Shared. None. Central Uva Total 162 38 45,275 15,187 2,950 1,232 1,108 358 3 4 27 17 23 49 17 36 24 38 17 35 89 21 200 60,462 4,182 1,866 7 44 23 66 36 24 55 36 no A comparison of these figures with those collected in the Central Province in 1926 is shown. Table No. 14.—A Comparison of Figures furnished by Inspecting Medical Officers in 1926 and 1927. d No. of Latrine #o Compart- General Sanitary Condition. Dispensers employed. Year. No. of Estates Visited. i a, O ' P< ments. Found. Requi¬ red. Very Good. Good. Very Fair. Fan. Poor. Bad. Yes. » Shared. None. 1927 200 60,462 4,182 1,866 7 44 23 66 36 24 55 35 110 1926 221 40,509 2,070 2,118 1 22 7 71 24 96 76 144 — The proportion of the number of latrines found to those required is much higher in 1927 than in 1926. In 1926 the general sanitary condition was as much as fair on 101 estates and poor to bad on 120; in 1927 the figures are 140 and 60 respectively. A fewer number of dispensers are shared in 1927. It would appear that sanitary progress on estates is being continued and improved with each succeeding year. Village.—Special treatment and sanitation work has been done in several snjall areas in the Western Province in past years. These areas were visited during the year, and the situation found is shown in Table No. 15. • % Table No. 15.—Census, Houses, Latrines, and Sanitary Inspectors in Horana, Gampaha, and Veyangoda Village Areas in 1926. Area. Census, 1921. No. of Houses, 1921 Number of Latrines Built.* t---i-- Prior to During During —“S Total. 1,915 . Number of Sanitary Inspectors Employed.’1' A Western Province. Horana .. .. 32,002 . Census. . 6,177 1926. .. 1,492 .. 1926. 201 .. 1927. 222 . . ' 1926. 5 . . 1927.' Gampaha .. 18,718 . . 3,701 .. 1,414 .. 93 .. - 17 .. 1,524 . 5 . . 3 Veyangoda . . 24,871 . . 5,065 .. 2,484 .. 142 .. 63 .. 2,689 . 8 .. ■ ' 7 Total . . 75,591 14,943 5,390 436 302 6,128 18 16: * Figures were supplied by the Assistant Director of Sanitary Services.](https://iiif.wellcomecollection.org/image/b31753280_0062.jp2/full/800%2C/0/default.jpg)