Leprosy in India : a report / by T.R. Lewis and D.D. Cunningham.
- Timothy Richards Lewis
- Date:
- 1877
Licence: Public Domain Mark
Credit: Leprosy in India : a report / by T.R. Lewis and D.D. Cunningham. Source: Wellcome Collection.
Provider: This material has been provided by The Royal College of Surgeons of England. The original may be consulted at The Royal College of Surgeons of England.
32/88 page 26
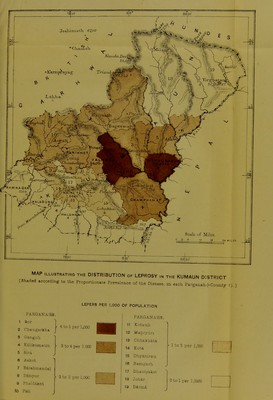
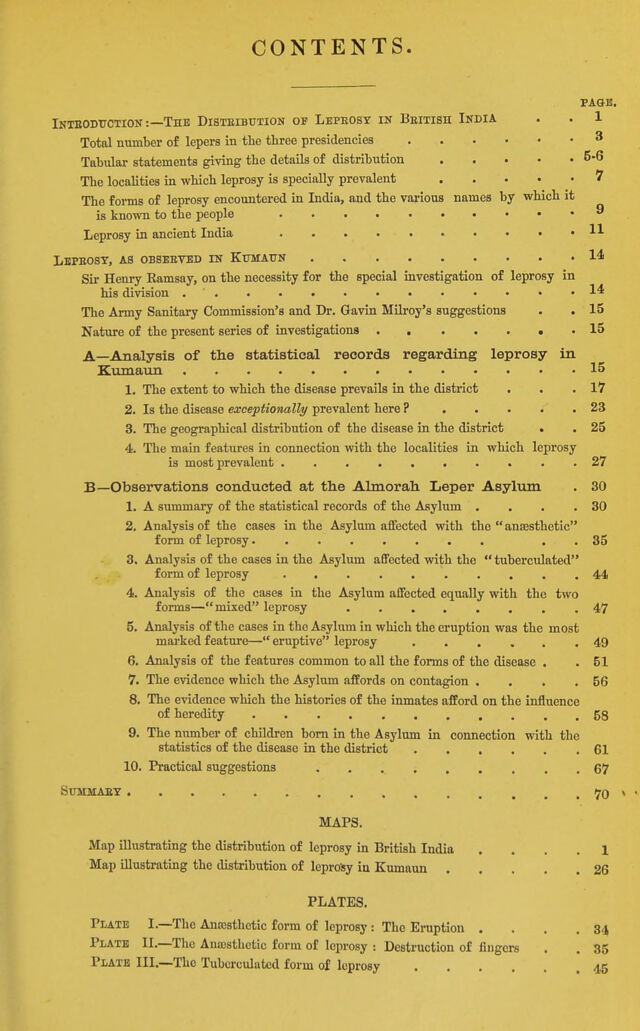
![periods mentioned, as well as the series of figures upon which the scale-shading of the map is based, which will be found in the fourth column of figures in the table. TABLE 6.—Showing the distribution of Leprosy hi each Fargana in Kumauii according to the Census of 1852, 1864, and 1872, together with the Mean of the Three Returns, arranged in order of severity in each case. 1852 Cbnsus. 1861 Cbnsus. 1872 Cbnsus. Mean of the: tbbeb Bbtubns. Order of severity. | Pargana. Total Lepers. Lepers per mille of population. order ot seventy. Pargana, Total Lepers. Lepers per mille of population. Order ot severity. Pargana. Total Lepers. Lepers per mille of population. order or seventy. Pargana. 3 i 3 M. P o a < 2 S.2 >- 3 o gi-? P. ] 3or 109 6'94 1 Chaugarkha 178 6'07 1 Chaugarkha 99 3-77 1 Chaugarkha 132 4-83 2 Chaugarkha 121 474 2 Sor 96 6'05 2 Kali Kumaun. L68 3-62 2 Sor 93 4'82 S Sira 19 4-20 3 Gangoli ... 74 3-74 3 Sor 76 3-47 3 Gangoli ... 64 3-37 i Eamgarh ... 18 3-70 4 Barahman- dal. 209 S-31 4 Gangoli ... 62 3-10 4 Kali Kumaun. 139 3-04 5 Barahman- dal. 203 349 6 Phaldakot... 52 3-19 6 Slra 22 2'66 5 Slra 20 3-00 6 Gangoli ... 66 3*29 6 Danpur ... 6 Askot ID Z 44 Askot 15 2-79 7 8 Askot Kali Kumaun. 16 138 8-11 3-05 7 8 9 Aekot Kotauli 1 Mahryfiri ) 17 32 2-88 2-66 7 8 Danpur ... Kota 61 1 2'02 1-95 7 8 Barabman- dal. Danpur ... 174 54 2-71 2-59 9 Danpur ... 49 2-97 10 Sira 21 2-60 9 Barahman- dal. 110 1-67 9 Phaldakot... 40 2-49 10 Phaldakot... 40 2'77 11 Pall 246 2-59 10 Phaldakot 28 1-64 10 Pali 19 2-10 11 12 Kotauli 1 Mahryiuri ) 30 2-67 12 Kal Kumaun. 111 2'51 11 Pall 123 1-31 11 12 Kotauli ^ Mahiyfiri j 22 1-64 13 pat 211 2-42 13 Kota 9 1-95 12 Dhy^,nirau 1 0-91 18 Chhakhata 9 1-20 14 Chhakbata 13 1-79 14 Ramgarh... 6 I'le IS Chhakhata 6 0-65 14 Kota 6 1-25 16 Dhaniyakot 17 1-48 1£ Darma 3 0-62 14 1> Kotauli 1 ) MahryOri j 6 0-49 1£ Dhyanirau.. 19 1-10 16 Dhyanirau 22 1-28 U ,Johar 6 0-60 1 3Johar 4 0-38 1 5 Ramgarh... 5 1-00 15 Koti 5 1-06 1' Dhaniyakot 6 0-47 17jRamgarh .. . 1 0-19 1 7 Dhaniyakot 8 070 If ) Jobar 9 0-96 IS i Chhakhata ? 1 18 Dhaniyakot 2 0-17 1 3Johar 6 0-64 19 Darms ... ? ? 1 3 Dhyanirau ? t 19 Darma ... 1 ? f 1 9 Darma .. 3 0'C2 A glance at the figures and at the map is sufficient to arrest attention at once to the fact The map shows that the disease that IcprOSV prevails tO a far prevails along the eastern side. ^^^^^^^ ^^^^^^ ^^^^^ ^^^^^^^ side of the district than along the western. This is not](https://iiif.wellcomecollection.org/image/b22287619_0034.jp2/full/800%2C/0/default.jpg)