Statistical reports on the sickness, mortality, & invaliding, among the troops in Western Africa, St. Helena, the Cape of Good Hope, and the Mauritius; : prepared from the records of the Army Medical Department and War-Office returns [by A.M. Tulloch, H. Marshall and T.G. Balfour]. / Presented to both Houses of Parliament by command of Her Majesty.
- Great Britain. Army Medical Services
- Date:
- 1840
Licence: Public Domain Mark
Credit: Statistical reports on the sickness, mortality, & invaliding, among the troops in Western Africa, St. Helena, the Cape of Good Hope, and the Mauritius; : prepared from the records of the Army Medical Department and War-Office returns [by A.M. Tulloch, H. Marshall and T.G. Balfour]. / Presented to both Houses of Parliament by command of Her Majesty. Source: Wellcome Collection.
Provider: This material has been provided by London School of Hygiene & Tropical Medicine Library & Archives Service. The original may be consulted at London School of Hygiene & Tropical Medicine Library & Archives Service.
90/126
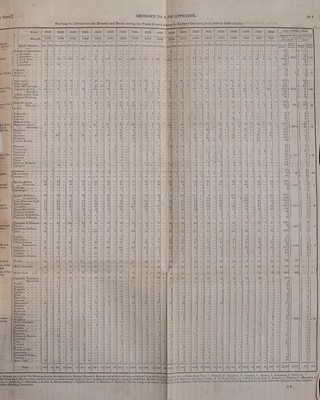
![Showing the Number of Admissions into Hospital and Deatiis among the Trooj s No. VI. OP APPENDIX. [Cape of Good Hopj. serving at the Cape op Good Hope, in eacli Month, from January 1823 to December 1834 inclusive. I. ADMISSIONS. * 2 ■|>s ii MONTHS. si g ! li 1 i i 1 < U ^ < ^ n 3 5 m Is , Yciirs . 1822 1823 182 4 1825 [,i86 January . 76 5 91 1 or 14 101 70 1 3 79 85 13 107 98 24 100 February . es 3 91 1 08 14 70 86 1 1 103 83 19 121 82 19 85 March . 83 4 82 67 23 81 47 1 4 74 108 21 115 8< 25 go ..\pril . . 100 10 59 87 10 91 50 21 86 119 17 119 67 20 May . . 137 10 03 63 13 69 61 11 81 114 12 121 105 27 96 121 12 71 68 10 62 45 i 73 122 21 74 83 24 87 July . '. 69 9 62 49 18 54 59 18 88 95 14 76 53 '( 19 Dj August . 77 10 78 03 9 89 23 102 81 15 80 40 ] '7 8G Supteaibur. 61 6 78 44 9 75 61 2 4 107 71 20 108 41 1 23 91) October . 85 73 51 9 71 87 14 127 103 18 98 44 1 Hi 101 November. 80 7 63 74 0 95 no 31 104 97 14 93 44 107 December. 95 6 70 87 2 76 88 19 103 77 23 92 45 ; 11 95 Total . 1052 87 886 8 68 163 900 853 208 1133 UCO 207 1209 i 786 244 U18 Years 1827 1828 1829 1830 i31 January . 61 27 100 86 7 80 72 15 104 59 28 108 89 37 February . 46 24 93 73 12 71 70 36 113 60 24 104 80 3(1 60 March . . 111 26 87 8-2 6 68 56 17 33 77 20 107 73 33 62 April • 49 23 68 44 6 57 55 13 104 53 6 104 75 I' 2.) 58 May . , 64 27 97 63 8 71 40 17 72 30 14 125 65 39 June . 58 17 84 48 9 84 44 15 77 47 113 00 40 56 July . . 56 13 83 27 7 72 29 14 87 56 16 95 51 26 fj7 August 33 9 74 21 4 33 I 95 33 10 101 65 30 G/ September. 53 11 81 31 15 79 37 12 107 81 38 109 76 39 5.') October . 66 19 79 49 21 101 37 11 118 69 31 117 80 18 52 November. 46 6 67 76 24 78 75 18 94 85 27 no 74 63 December . 59 16 65 66 18 9G 69 17 93 77 29 93 73 32 Total . 707 217 978 666 137 912 617 200 1147 733 248 1291 8^7 383 741 Years . 1832 1833 1834 Total for 13 Years. Januaiy . 84 31 107 75 16 95 31 17 110 993 247 1251 February . 63 13 71 52 8 83 33 12 94 909 225 1164 March . 41 10 79 63 16 81 35 13 100 927 228 1099 ! April . 9 80 58 17 86 27 14 91 839 190 1099 May . . 43 11 92 54 n 87 34 18 92 879 218 1146 June • • 45 14 74 66 11 69 29 1 5 81 836 208 1005 July . . 43 13 84 44 14 62 27 I 6 79 653 197 1004 August • 41 9 88 63 12 63 24 1 4 83 068 183 1027 September. 30 12 80 62 18 89 29 1 83 677 242 1141 October ■ 34 11 99 54 18 73 27 1 3 78 786 204 1187 November * 65 ■ 19 131 58 19 25 1 1 82 909 239 UJ7 December . 33 15 81 42 18 69 19 1 2 75 356 228 107O Total . 597 167 1066 6 91 178 912 340 17 0 1048 9937 2609 13340 H. DEATHS. Years January February March . April . May . June . July . Years January February March April May Juiiu Auj^ust September October November December Total. Jantiary February March April May July August September October November December ■i i < i 1 1 1822 Total for 13 Years.](https://iiif.wellcomecollection.org/image/b21365313_0090.jp2/full/800%2C/0/default.jpg)


 No text description is available for this image
 No text description is available for this image
 No text description is available for this image