Abstract of the answers and returns made pursuant to an act, passed in the first year of the reign of His Majesty King George IV, intituled, "An act for taking an account of the population of Great Britain, and of the increase or diminution thereof" : M. DCCC. XXI [1821].
- General Register Office Northern Ireland
- Date:
- 1822
Licence: Public Domain Mark
Credit: Abstract of the answers and returns made pursuant to an act, passed in the first year of the reign of His Majesty King George IV, intituled, "An act for taking an account of the population of Great Britain, and of the increase or diminution thereof" : M. DCCC. XXI [1821]. Source: Wellcome Collection.
Provider: This material has been provided by Royal College of Physicians, London. The original may be consulted at Royal College of Physicians, London.
26/764
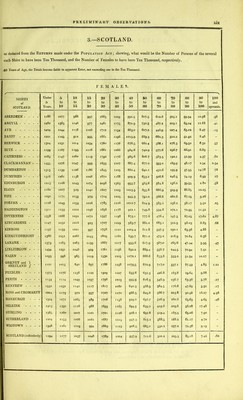
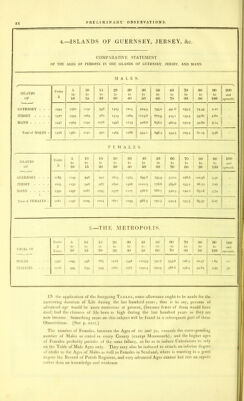
![4.—ISLANDS OF GUERNSEY, JERSEY, &c. COMPARATIVE STATEMENT OF THE AGES OF PERSONS IN THE ISLANDS OF GUERNSEY, JERSEY, AND MANN. MALE S. / ISLANDS OF Under 5 5 to 10 10 to 15 15 to 20 20 to 30 30 to 40 40 to 50 50 to (50 00 to 70 70 to 80 80 to 90 90 to 100 \ 100 and upwards. GUERNSEY - - - 1454 1370 1150 958 1329 1215 924-5 795-2 491.6 235-3 74-59 2.10 - JERSEY .... 1527 1343 1064 962 1519 1264 1015.6 672.5 4151 159-3 53-62 4.60 - MANN 1457 •369 1191 1026 1496 1119 926.8 658.2 462.9 230.9 59-69 3-14 - Total of MALES - 1478 1361 1 141 990 1465 1186 954-1 696.4 454-5 2095 61.19 3-36 - F E M ALE S. ( A Und- 5 10 15 20 30 40 50 GO 70 80 90 100 ISLANDS to to to to to to to to to to to and OF 5 10 15 20 30 40 50 00 70 80 90 100 upwards. GUERNSEY - - - 1183 H49 948 942 1815 1374 895-8 795-9 512.0 276.8 102.58 5-3i - JERSEY --- - 1223 1130 946 987 1690 1306 1020.3 776.6 5696 255-2 88.72 7.07 - MANN 1332 1258 1088 • f>95 1578 1 117 968.8 688.2 540.5 244.2 83.16 5-74 - Total of FEMALES - 1261 1190 1009 1024 1671 1239 988.3 742-5 543-3 255-5 89-57 6.07 - .5.—THE METROPOLIS. Under „ 1 O 10 15 I 20 30 40 50 GO 70 80 90 100 5 to to to to to to to to to In to TOTAL OI Years. 10 15 20 30 40 50 GO 70 80 90 100 upwards. MALES - - - 1397 1095 936 865 ^ 1718 1548 1203.9 730.7 353-6 128.5 22.47 1.69 .21 FEMALES - - - 1216 995 834 959 1 2062 1567 1092.4 690.9 388.8 156.4 34-64 3-93 •32 IN the application of the foregoing Tables, some allowance ought to be made for the increasing duration of Life during the last hundred years; that is to say, persons of advanced age would be more numerous at present, (because fewer of them would have died) had the chances of life been as high during the last hundred years as they are now become. Something more on this subject will be found in a subsequent part of these Observations. [See p. xxvi.] The number of Females, between the Ages of 20 and 30, exceeds the corresponding number of Males as stated in every County (except Monmouth); and the higher ages of Females probably partake of the same fallacy, so far as to induce Calculators to rely on the Table of Male Ages only. They may also be induced to attach an inferior degree of credit to the Ages of Males as well as Females in Scotland, where is wanting in a great degree the Record of Parish Registers, and very advanced Ages cannot but rest on repute rather than on knowledge and evidence.](https://iiif.wellcomecollection.org/image/b28406606_0026.jp2/full/800%2C/0/default.jpg)