Report of the Medical Officer of Health / Municipality of Colombo.
- Colombo (Sri Lanka). Public Health Department
- Date:
- [1909]
Licence: Public Domain Mark
Credit: Report of the Medical Officer of Health / Municipality of Colombo. Source: Wellcome Collection.
36/42 (page 92)
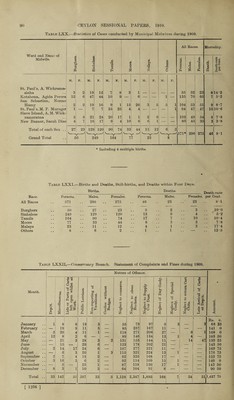
![Table LXXV.—Births and Deaths and their Rates for each Race in the Town of Colombo for the Year 1909, and the Average for 1899 to 1908. Race. Estimated Population, inclusive of the Military, for the Middle of 1909. Births. Deaths. Birth-rate per Miile per Annum. Death-rate per Mille per Annum. Aver¬ age, 1899 to 1908. 1908. 1909. Aver¬ age, 1899 to 1908. 1908. 1909. Aver¬ age, 1899 to 1908. 1908. 1909. Aver¬ age, 1899 to 1908. 1908. 1909. All Races 183,872 3,868 4,602 4,589 5,654 6,620 6,169 23-5 25-5 25-0 34-3 36-7 33 -5 Europeans 3,046 83 77 64 84 105 69 29-7 25-7 20-9 29-9 ' 35-1 22-5 Burghers 12,866 392 434 463 323 386 323 32-4 34-1 35-8 26-7 30-3 24-9 Sinhalese 76,449 2.106 2.608 2,556 2,623 3,312 2,958 29 • 7 34-5 33 2 36-9 43-9 38-4 Tamils 46,028 466 562 595 1,316 1,343 1,502 12-5 12-6 12-8 35-4 30-2 32-3 Moors 32,970 627 678 671 965 1,067 990, 21-1 20-9 20-2 32 2 32-9 29-8 Malays 5,594 134 172 169 169 196 178 28-2 31-6 23 9 355 36-0 31-7 Others 6,919 60 71 71 174 211 149 11-7 10-8 10-2 331 32- 1 21-4 [For Table LXXVI. see page 93.] Table LXXVII.—Deaths of Males and Females at different Age Periods for each Race in the Colombo Municipality during the Year 1909. | Age at Death. Europeans. Burghers. Sinhalese. Tamils. Moors. Malays. Others. All Races. . M. F. M. F. M. F. M. F. M. F. M. F. M. F. M. F. Under 1 year of age (see particulars on statement) 6 3 47 37 401 346 134 106 143 116 35 23 11 15 777 646 Under Five Years— 1 year and under 2 2 — 14 10 104 126 38 39 34 31 9 6 o 3 203 215 2 years and under 3 — 1 5 10 59 72 15 24 26 25 3 3 — 2 108 137 3 years and under 4 — — 6 6 31 38 13 15 10 15 3 3 2 — 65 77 4 years and under 5 — — 1 4 25 23 8 6 12 15 1 4 1 2 48 54 Over Five Years— 5 years and under 10 1 — 10 2 64 66 20 17 20 16 2 4 4 4 121 109 10 years and under 15 — — 5 3 38 43 22 12 12 10 2 3 1 — 80 71 15 years and under 20 — — 4 4 53 55 81 29 22 27 — 3 5 2 165 120 20 years and under 25 6 8 8 83 80 98 35 22 25 6 6 10 2 233 156 25 years and under 35 16 2 14 12 186 160 176 87 68 45 3 8 26 3 489 317 35 years and under 45 8 2 10 8 141 103 125 44 46 21 4 5 12 3 346 186 45 years and under 55 6 3 11 10 126 81 91 37 37 17 ' 4 1 7 — 282 149 55 years and under 65 7 1 15 18 105 65 87 23 40 11 3 2 10 — 267 120 65 years and under 75 3 1 9 10 55 43 39 18 24 18 9 7 5 1 144 98 75 years and under 85 — — 7 7 50 52 22 13 18 19 4 5 6 6 107 102 35 years and over — 1 4 4 30 54 17 11 17 28 4 3 3 1 75 102 Total 55 14 170 153 1551 1407 986 516 551 439 92 86 105 44 3510 2659 A_ J _J v. A , _J A_ _j V__ _J r Persons .. 69 323 2,958 1,502 990 178 149 6,169](https://iiif.wellcomecollection.org/image/b31753358_0036.jp2/full/800%2C/0/default.jpg)