Atmospheric pollution in Leicester : a scientific survey.
- Great Britain. Atmospheric Pollution Research Board.
- Date:
- 1945
Licence: Public Domain Mark
Credit: Atmospheric pollution in Leicester : a scientific survey. Source: Wellcome Collection.
57/178 page 45
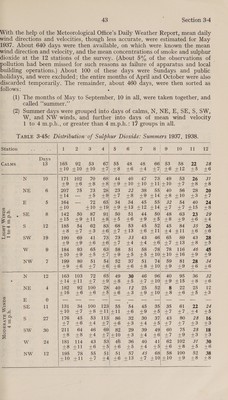
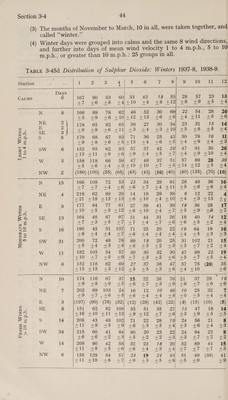
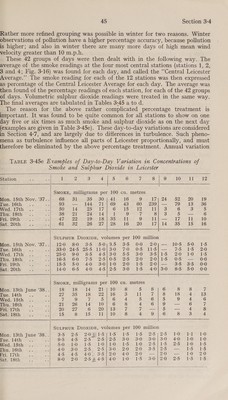
![Rather more refined grouping was possible in winter for two reasons. Winter observations of pollution have a higher percentage accuracy, because pollution is higher; and also in winter there are many more days of high mean avamniel velocity greater than 10 m.p.h. These 42 groups of days were then dealt with in the following way. The average of the smoke readings at the four most central stations (stations 1, 2, 3 and 4; Fig. 3-16) was found for each day, and called the “‘Central Leicester Average.’’ The smoke reading for each of the 12 stations was then expressed as percentage of the Central Leicester Average for each day. The average was then found of the percentage readings of each station, for each of the 42 groups of days. Volumetric sulphur dioxide readings were treated in the same way. The final averages are tabulated in Tables 3-45 a to d. The reason for the above rather complicated percentage treatment is important. It was found to be quite common for all stations to show on one day five or six times as much smoke and sulphur dioxide as on the next day (examples are given in Table 3-45e). These day-to-day variations are considered in Section 4-7, and are largely due to differences in turbulence. Such pheno- mena as turbulence influence all parts of Leicester proportionally, and must therefore be eliminated. by the above percentage treatment. Annual variation TABLE 3:45e Examples of Day-to-Day Variation in Concentrations of Smoke and Sulphur Dioxide in Leicester Station He re H Cen ae es ee Te per | Or keke bl he SMOKE, milligrams per 100 cu. metres Mon. 15th Nov. ’37.. 68 31 30 -2305)e44 16 9 iio: Beet. 20 19 fue. 16th .. ise O35 as PAG FI GOO. 4S 4 GO 4280 | 32°79 13 36 Wed. 17th .. oe; 50 14 vas eka ef 4 6 15 4 11 © 6 3 5 Thu. 18th ~.. 2: 38) 21 Dare 14 1 9 7 Si BS fF er 6 Fri. 19th ae 76 4757. 22 19 181] 35 11 9 Wit 17 11 10 Sat. 20th mt a 61 32 264527, 428 16 20 £7114. ; 35 15 16 SULPHUR DIOXIDE, volumes per 100 million ions: 15th Nov. ’37<.)):12-0- 8:0) :'.3-5: 65:01,3.5;6 3-5 0:0 4; 2:0} — 10-5). 5:0..0 15 mere: 16th... adi peows-24%5,. 2°5.. 11°01)-3:0 7:0. Orde 115 | a a: 78 8. 20 med. 1/th. .. ieee Oo - SO, AOS Or BOO. OO, oO) ben 200 IO sik mae. 18th ~~. PiEelGo- GU “AsO, 2 O20 aro se» ZO Pla or eG Fri. 19th re MSDS S> § S400 2420 = 73-010 T2ON eoo 2-0 ISS) SOLO) sat. 20th ... sap BAO 6:5. 4:062.4:5 2-5-6 3:0 2-95) 1 40 3:0: 8ST. 5050-0 SMOKE, milligrams per 100 cu. metres Mon. 13th June ’38.. 1677-98 SUT 4) ZTE 8 5 8 | 6 ort AS 7 mie. 14th .. 2 BE 30 ASe- 22416 a alt ANS 18.344 13 Wed. 15th .. oat 7 9 7, Dis 2. 5 6 | 5 9 4 6 mu. 16th ~~... fe Dias oO) La TOS 8 4 6,;,9 —: 6 7 Beet/th* i 20° 27 6 205713 7 Toefl ee 8 pmeeaGth. fle. yi 15 Ba 15 fy TEs 10 8 4 Di ji 6 8 3 4 SULPHUR D1oxIDE, volumes per 100 million Men toth pune 36.0) °S°S 2-5 20 tot oe a V5) 2S) 25 Oe el oe tO Fue. 14th .. ' O 5nd (251° Bato, AS-02013:01713-0 S017 4-08 11-0286 Wed. 15th SOO wel =i Tk Onde Ot tole. daO%, 2-5) 1-0; BOs. 0120... hS Phu. 16th AO eS). 220 Daal BO 2) 4 220: SO. | Qe oe De 155 Pri. 17th AS 4:5. 4-045, 8:50 200 4-0 20 1 20 |e aaa 99) Sat. 18th Se 2 Or loge Sop Aer Ore PSF SON Oe so! LS IES](https://iiif.wellcomecollection.org/image/b32179467_0057.jp2/full/800%2C/0/default.jpg)
 No text description is available for this image
 No text description is available for this image
 No text description is available for this image