Atmospheric pollution in Leicester : a scientific survey.
- Great Britain. Atmospheric Pollution Research Board.
- Date:
- 1945
Licence: Public Domain Mark
Credit: Atmospheric pollution in Leicester : a scientific survey. Source: Wellcome Collection.
69/178 page 57
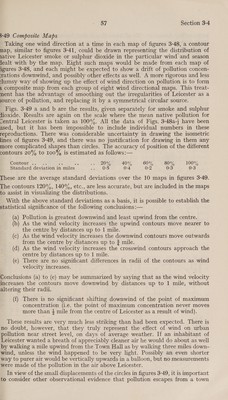
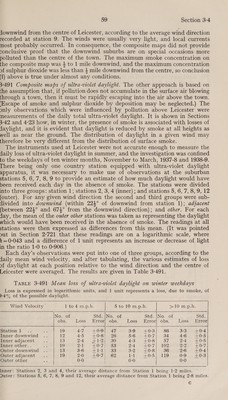
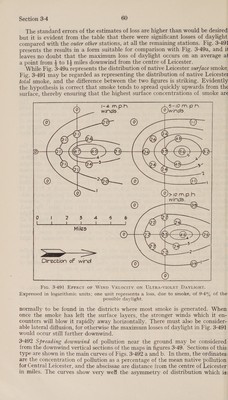
![3-49 Composite Maps Taking one wind direction at a time in each map of figures 3-48, a contour nap, similar to figures 3-41, could be drawn representing the distribution of ative Leicester smoke or sulphur dioxide in the particular wind and season lealt with by the map. Eight such maps would be made from each map of igures 3-48, and each might be expected to show a drift of pollution concen- rations downwind, and possibly other effects as well. A more rigorous and less slumsy way of showing up the effect of wind direction on pollution is to form 2 composite map from each group of eight wind directional maps. This treat- ment has the advantage of smoothing out the irregularities of Leicester as a source of pollution, and replacing it by a symmetrical circular source. Figs. 3-49 a and b are the results, given separately for smoke and sulphur dioxide. Results are again on the scale where the mean native pollution for ventral Leicester is taken as 100°. All the data of Figs. 3-48a-] have been used, but it has been impossible to include individual numbers in these reproductions. There was considerable uncertainty in drawing the isometric lines of figures 3-49, and there was no justification for drawing in them any more complicated shapes than circles. The accuracy of position of the different contours 20% to 100% is estimated as follows:— Contour .. Sores 0 40Y, G0 B06 7 1009, Standard deviation in 2 miles a U5 0-4 (02 0-3 0-3 These are the average standard deviations over the 10 maps in figures 3-49. The contours 120%, 140%, etc., are less accurate, but are included in the maps to assist in visualizing the distributions. With the above standard deviations as a basis, it is possible to establish the statistical significance of the following conclusions :— (a) Pollution is greatest downwind and least upwind from the centre. (b) As the wind velocity increases the upwind contours move nearer to the centre by distances up to | mile. (c) As the wind velocity increases the downwind contours move outwards from the centre by distances up to ? mile. (d) As the wind velocity increases the. crosswind contours approach the © centre by distances up to 1 mile. (e) There are no significant differences in radii of the contours as wind velocity increases. Conclusions (a) to (e) may be summarized by saying that as the wind velocity increases the contours move downwind by distances up to 1 mile, without altering their radii. (f) There is no significant shifting downwind of the point of maximum concentration (i.e. the point of maximum concentration never moves more than 4 mile from the centre of Leicester as a result of wind). These results are very much less striking than had been expected. There is no doubt, however, that they truly represent the effect of wind on urban pollution near street level, on days of average weather. If an inhabitant of Leicester wanted a breath of appreciably cleaner air he would do about as well by walking a mile upwind from the Town Hall as by walking three miles down- wind, unless the wind happened to be very light. Possibly an even shorter way to purer air would be vertically upwards in a balloon, but no measurements were made of the pollution in the air above Leicester. In view of the small displacements of the circles in figures 3-49, it is important to consider other observational evidence that pollution escapes from a town](https://iiif.wellcomecollection.org/image/b32179467_0069.jp2/full/800%2C/0/default.jpg)
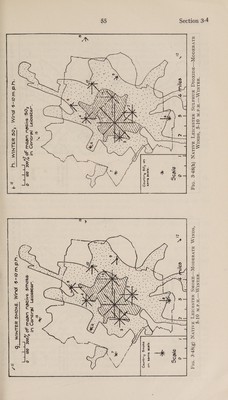
 No text description is available for this image
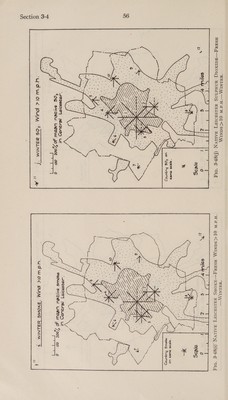
 No text description is available for this image
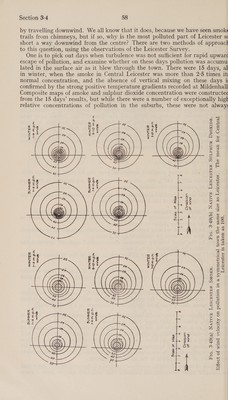
 No text description is available for this image