Atmospheric pollution in Leicester : a scientific survey.
- Great Britain. Atmospheric Pollution Research Board.
- Date:
- 1945
Licence: Public Domain Mark
Credit: Atmospheric pollution in Leicester : a scientific survey. Source: Wellcome Collection.
72/178 page 60
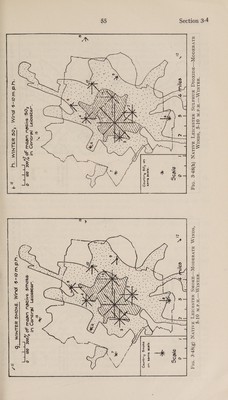
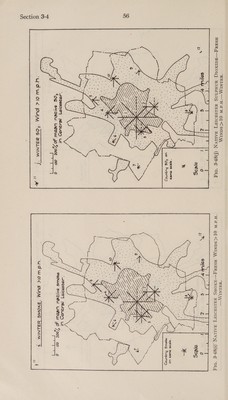
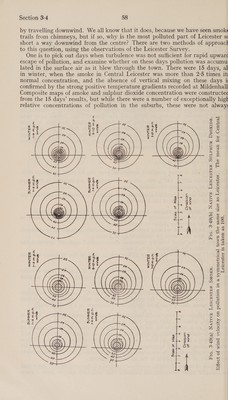
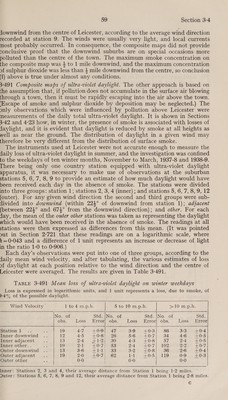
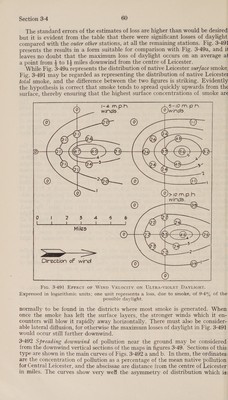
![The standard errors of the estimates of loss are higher than would be desired but it is evident from the table that there were significant losses of daylight compared with the outer other stations, at all the remaining stations. Fig. 3-49] presents the results in a form suitable for comparison with Fig. 3-49a, and 11 leaves no doubt that the maximum loss of daylight occurs on an average at a point from $ to 14 miles downwind from the centre of Leicester. While Fig. 3-49a represents the distribution of native Leicester surface smoke. Fig. 3-491 may be regarded as representing the distribution of native Leicester total smoke, and the difference between the two figures is striking. Evidently the hypothesis is correct that smoke tends to spread quickly upwards from the surface, thereby ensuring that the highest surface concentrations of smoke are ©) ween OW re © G9) ©) C7) :1) eA pe : o—t€) G-e> as (ere ens Linear tia Nl S@—s- D) G4 © Direction oF wind Fic. 3-491 EFrect oF WIND VELOCITY ON ULTRA-VIOLET DAYLIGHT. Expressed in logarithmic units; one unit represents a loss, due to smoke, of 9:-4% of the possible daylight. normally to be found in the districts where most smoke is generated. When once the smoke has left the surface layers, the stronger winds which it en- counters will blow it rapidly away horizontally. There must also be consider- able lateral diffusion, for otherwise the maximum losses of daylight in Fig. 3-491 would occur still farther downwind. 3-492 Spreading downwind of pollution near the ground may be considered. from the downwind vertical sections of the maps in figures 3-49. Sections of this: type are shown in the main curves of Figs. 3-492 a and b. In them, the ordinates; are the concentration of pollution as a percentage of the mean native pollution. for Central Leicester, and the abscissae are distance from the centre of Leicester in miles. The curves show very well the asymmetry of distribution which is:](https://iiif.wellcomecollection.org/image/b32179467_0072.jp2/full/800%2C/0/default.jpg)
 No text description is available for this image
 No text description is available for this image
 No text description is available for this image