[Report 1949] / Medical Officer of Health, Montgomeryshire County Council.
- Montgomeryshire (Wales). County Council.
- Date:
- 1949
Licence: Attribution 4.0 International (CC BY 4.0)
Credit: [Report 1949] / Medical Officer of Health, Montgomeryshire County Council. Source: Wellcome Collection.
59/62 page 57
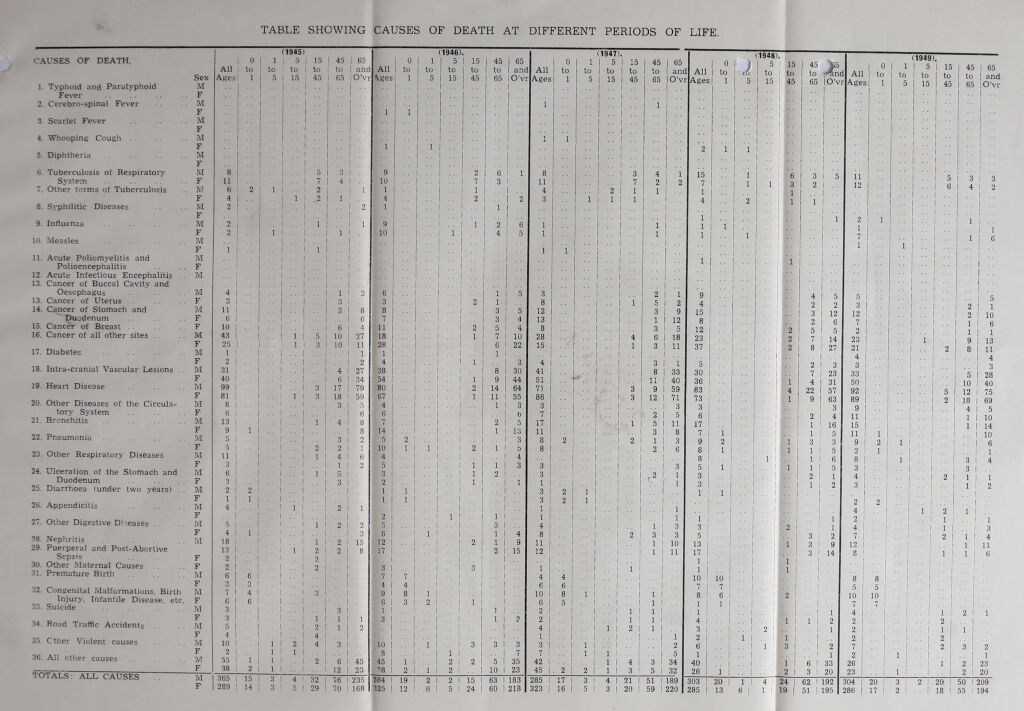
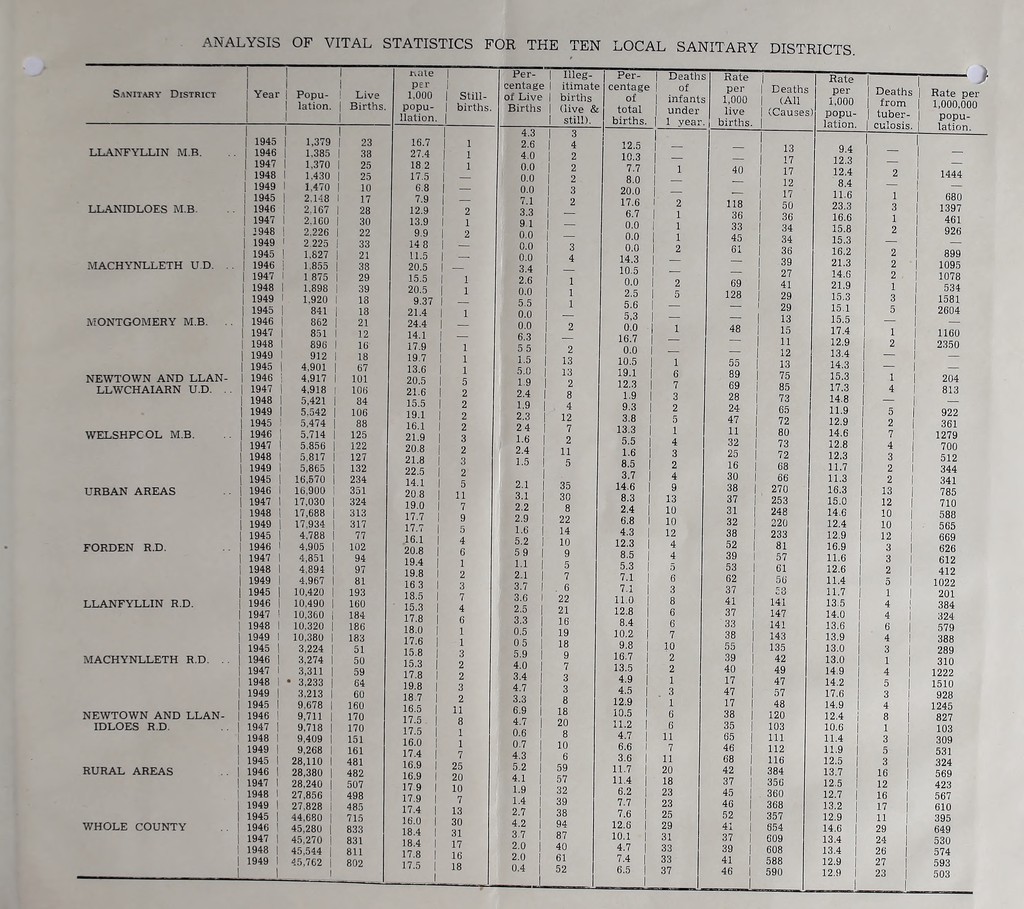
![ANALYSIS OF VITAL STATISTICS FOR THE TEN LOCAL SANITARY DISTRICTS Sanitary District I I 1 Year I Popu- ! lation. I Live Births. 1 1 1945 1 1,379 1 23 LLANFYLLIN M.B. i 1946 1.385 1 38 1947 1,370 1 25 1948 1 1,430 1 25 1949 1 1,470 1 10 1945 ! 2,148 1 17 LLANIDLOES M.B. 1946 1 2.167 1 28 1947 1 2.160 1 30 J948 1 2,226 1 22 1949 1 2.225 1 33 1945 1 1,827 1 21 MACHYNLLETH U.D. . . 1946 i 1.855 1 38 1947 1 1 875 1 29 1948 1 1,898 1 39 1949 i 1,920 1 18 1945 1 841 1 18 MONTGOMERY M B. . . 1946 ! 862 1 21 1947 1 851 1 12 1948 1 896 1 16 1949 1 912 1 18 1945 1 4,901 1 67 NEWTOWN AND LLAN- 1946 i 4.917 1 101 LLWCHAIARN U.D. . . 1947 1 4,918 106 1948 1 5,421 i 84 1949 1 5.542 1 106 1945 5,474 1 88 WELSHPCOL M.B. 1946 1 5,714 1 125 1947 1 5.856 1 122 1948 1 5,817 1 127 1949 1 5,865 1 132 1945 1 16,570 1 234 URBAN AREAS 1946 1 16,900 i 351 1947 1 17,030 1 324 1948 1 17,688 1 313 1949 1 17.934 1 317 1945 1 4.788 1 77 FORDEN R.D. 1946 ' 4,905 1 102 1947 1 4,851 1 94 1948 1 4,894 1 97 1949 1 4,967 1 81 1945 1 10,420 1 193 LLANFYLLIN R.D. 1946 1 10.490 1 160 1947 ! 10,360 1 184 1948 1 10.320 1 186 1949 1 10,380 1 183 1945 1 3,224 1 51 MACHYNLLETH R.D. . . 1946 1 3,274 1 50 1947 1 3,311 1 59 1948 1 • 3,233 1 64 1949 1 3,213 1 60 1945 1 9,678 1 160 NEWTOWN AND LLAN- 1946 1 9,711 1 170 IDLOES R.D. 1947 1 9,718 1 170 1948 1 9,409 1 151 1949 1 9,268 1 161 1945 1 28,110 1 481 RURAL AREAS 1946 1 28,380 1 482 1947 1 28,240 1 507 1948 1 27,856 1 498 1949 1 27.828 i 485 1945 1 44,680 1 715 WHOLE COUNTY 1946 1 45,280 1 833 1947 1 45,270 1 831 1948 1 45,544 1 811 1949 1 1 45,762 1 1 802 i\ale per 1.000 popu- ilation. Still- births, Per- 1 centage 1 of Live 1 Births 1 1 1 4.3 1 16.7 1 1 2.6 1 27.4 1 1 4.0 1 18 2 1 1 0.0 1 17.5 1 — 0.0 1 6.8 1 — 0.0 1 7.9 1 — 7.1 1 12.9 1 2 3.3 1 13.9 1 1 9 1 1 9.9 1 2 0.0 1 14 8 1 — 0.0 1 11.5 1 — 0.0 1 20.5 1 — 3.4 1 15.5 1 1 2.6 1 20.5 1 1 0.0 1 9.37 1 — 5.5 1 21.4 1 1 0.0 1 24.4 1 — 0.0 1 14.1 ] — 6.3 1 17.9 1 1 55 1 19.7 1 1 1.5 1 13.6 1 1 5.0 1 20.5 1 5 1.9 1 21.6 1 2 2.4 1 15.5 1 2 1.9 1 19.1 1 2 2.3 1 16.1 1 2 24 1 21.9 1 3 1.6 1 20.8 1 2 2.4 1 21.8 1 3 1.5 1 22.5 1 2 1 14.1 1 5 2.1 1 20.8 1 11 3.1 1 19.0 1 7 2.2 1 17,7 1 9 2.9 1 17.7 1 5 1.6 1 16.1 1 4 5.2 1 20.8 1 6 59 1 19.4 1 1 1.1 1 19.8 1 2 2.1 1 16 3 1 3 3.7 1 18,5 1 7 3.6 1 15.3 1 4 2.5 1 17.8 1 6 3.3 1 18,0 1 1 0.5 1 17.6 1 1 05 1 15.8 1 3 5.9 1 15.3 1 2 4.0 1 17.8 1 2 3.4 1 19.8 1 3 4.7 1 18.7 1 2 3.3 1 16.5 1 11 6.9 1 17.5. 1 8 4.7 1 17.5 1 1 0.6 1 16.0 1 1 0.7 17.4 1 7 4.3 1 16.9 1 25 5.2 1 16.9 1 20 4.1 1 17.9 1 10 1.9 1 17.9 1 7 1.4 1 17.4 1 13 2.7 1 16.0 1 30 4.2 1 18.4 1 31 3.7 1 18.4 1 17 2.0 1 17.8 1 16 2.0 1 17.5 1 1 18 0.4 1 1 Illeg- itimate I births (live & I still). 2 13 13 2 8 4 12 7 2 11 5 Per- centage of total births. Deaths of infants under 1 year. Rate per 1,000 live births. i Deaths (All (Causes Rate per 1,000 popu- lation 12.5 — 13 9.4 10.3 — - 17 12.3 7.7 1 40 17 12.4 8.0 — — 12 8.4 20.0 — — 17 11.6 17.6 2 118 50 23.3 6.7 1 36 36 16.6 0.0 1 33 34 15.8 0.0 1 45 34 15.3 0.0 2 61 36 16.2 14.3 — — 39 21.3 10.5 — - 27 14.6 0.0 2 69 41 21.9 2.5 5 128 1 29 15,3 5.6 — 1 29 15.1 5,3 — 1 13 15.5 0.0 1 48 1 15 17.4 16.7 1 11 12.9 0.0 — j 12 13.4 10.5 1 55 1 13 14.3 19.1 6 89 1 75 15.3 12.3 7 69 1 85 17.3 1.9 3 28 1 73 14.8 9.3 2 24 1 65 11.9 3.8 5 47 1 72 12.9 13.3 1 11 1 80 14.6 5.5 1 4 32 1 73 12.8 1.6 1 3 25 1 72 12.3 8.5 1 2 16 1 68 11.7 3.7 1 4 30 1 66 11.3 14.6 1 9 38 1 270 16.3 I I ivcjLe per I from I 1,000,000 I tuber- I popu- I culosis. I lation. I - i - I 1444 I - I 680 1397 461 926 899 1095 1078 534 1581 2604 1160 2350 204 813](https://iiif.wellcomecollection.org/image/b28862545_0059.jp2/full/800%2C/0/default.jpg)