Nutrition and health in old age : the cross-sectional analysis of the findings of a survey made in 1972/3 of elderly people who had been studied in 1967/8 : report / by the Committee on Medical Aspects of Food Policy.
- Great Britain. Committee on Medical Aspects of Food Policy
- Date:
- 1979
Licence: Open Government Licence
Credit: Nutrition and health in old age : the cross-sectional analysis of the findings of a survey made in 1972/3 of elderly people who had been studied in 1967/8 : report / by the Committee on Medical Aspects of Food Policy. Source: Wellcome Collection.
86/228 (page 72)
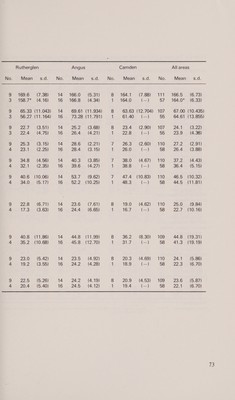
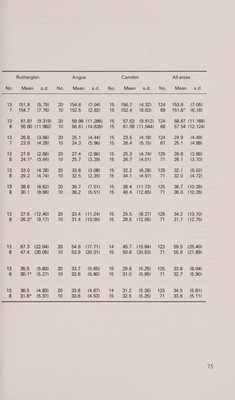
![Table 6.7: The means, and standard deviations of the mean, for various anthropometric indices' of men in the survey in two age groups in the different areas Portsmouth Cambridgeshire Sunderland Men No. Mean s.d. No. Mean s.d. No. Mean — s.d. Height (cm) under 80 yrs Toe 167-28 45573) BJ.» 1060,99 6 9(6:23) 40 165.9 (7.49) 80 yrs and over 5. 167.0. (6.71) 16 165.1 (7.44) 16 160.3** (5.30) Weight (kg) under 80 yrs 13 68.08 (9.574) 27 67.56 (10.015) 36 66.36 (10.182) 80 yrs and over 5 69.58 (10.074) 16 65.91 (14.011) 14 53.46*** (10.270) Quetelet’s Index under 80 yrs 1 Sau 24-3800 S,09) sr 2/247 ee (S520) 36 23.9 (3.09) 80 yrs and over 59e 25,00 (3277) 16 24.1 (4.14) 14 20.9** (3.64) Arm circumference (cm) under 80 yrs 13 28:0. (1.89) 27 = 26.9 (3.19) AQ] 22 (3.00) 80 yrs and over Seo a7 0) 16° 27.0 — (3.7/4) 16 24.0** (3.69) Lean arm radius (mm) under 80 yrs 1S e300 seni 2510) 27 SOG a 115-04) 40 36.6 (5.13) 80 yrs and over 5 39.5 (4.06) 16 36.2. (3.92) 160ess 2. (5.58) Arm muscle area (sq cm) under 80 yrs 13 oe © 405240959) gree) 845-2 9,03) 40 45.4 (11.59) 80 yrs and over 5 51.5: (10.45) 16 44.3 (9.61) 16.3 722- (11.44) Skinfold thickness (mm) isum of triceps, subscapular) under 80 yrs 13@mee2 070 oe Gs 79) 27 20; \aee 7.00} 395 27.0 (12.82) 80 yrs and over 5 20.6 (8.88) 16 26.2 (11.28) 16 19.8 (12.67) Skinfold thickness (mm) (sum of biceps, triceps subscapular, suprailiac) under 80 yrs 12 == 40100 (13:03) 27 © 4320-18971) 395504 (27.07) 80 years and over 5 36.9 (16.79) 16 44.5 (19.85) 16.%32.2 (25.93) Percentage of body fat (2 sites) under 80 yrs 13 24.5 (5.98) 27 24.3 (5.85) 395) 2541 (6.39) 80 yrs and over 5» 20:9 47,09) 16 24.57 (7-26) Gees oS - (7.88) Percentage of body fat (4 sites) under 80 yrs 128 -22.0% (5:83) 927) 9237258 (5: 75) a9 ees (6.74) 80 yrs and over 5 20.4 (7.47) 165723719741) 16 19.7* (7.90) a) ‘see Appendix C Tests of significance * P<0.05 ae eOLOI mean values of subjects 80 years and over were significantly less than the means for those “Te SAL 0)K0,0))|](https://iiif.wellcomecollection.org/image/b32221964_0086.jp2/full/800%2C/0/default.jpg)