[Report 1961] / Medical Officer of Health, Exmouth U.D.C.
- Exmouth (England). Urban District Council.
- Date:
- 1961
Licence: Attribution 4.0 International (CC BY 4.0)
Credit: [Report 1961] / Medical Officer of Health, Exmouth U.D.C. Source: Wellcome Collection.
13/66
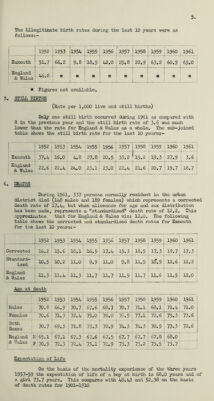
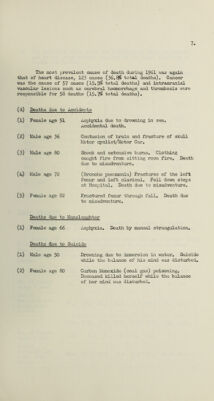
![5. The illegitimate birth rates during the last 10 years were as follows:- j j 1952 j1953 jl954 j1935 | 1936 [l957 j1938 j 1939 | I960 | 1961 I Exmouth j 51.7 I 66.2 j 9.8 j18.5 j 42.0 j 25.8 j 22.9 j 63.2 | 60.9 j 65.0 i f * : : i j t * \ * j ! England ! . c n I i ! i • j : : i & Wales j : : • j :• : : : * Figures not available. 5. STILL BIRTHS (Rate per 1,000 live and still births) Only one still birth occurred during 1961 as compared with 8 in the previous year and the still birth rate of 3.6 was much lower than the rate for England & Wales as a whole. The sub-joined table shows the still birth rate for the last 10 years | 1952 | 1953 | 1954 j1953 j 1956 j 1957 j 1958 11959 I I960 ; 1961 ; Exmouth j 37.4 j 16.0 I 4.8 27.8: 20.5 ; 33.2 f15.2 j19.3 I 27.9 j 3.6 j j : ; H ; ( i j * < ? E&*wSes I 22,6 i 22*4 I 24-° I 23.! | 23.0 j 22.4 | 21.6 j 20.7 j 19.7 118.7 j 6. DEATHS During 1961, 337 persons normally resident in the urban district died (148 males and 189 females) which represents a corrected death rate of 17.4, but when allowance for age and sex distribution has been made, represents a standardised death rate of 12.2. This approximates that for England & Wales viz: 12.0, The following table shows the corrected and standardised death rates for Exmouth for the last 10 years:- Corrected : 16.2 j 15.6 ! 18.1: 16.5 i 17.4 ! 15.3 j 18.5 ! 17.31 19.7! 17.3 :: Standard- ised j 10.5 j 10.2 j 11.0 ! 9.9 ! 11.0 ! 9.8 | 11.5 j 10'.9 j 12.6 i 12.2 ! England & Wales | 11.3 : 11.4 ; 11.3 11.7 11.7 j 11.5 ] 11.7 j 11.6 j 11.5! 12.0 | Age at death I952'! 1953 ! 1954: 1955 ; 1956 : 1957 : 1958 i 1959 : i960 1961 j ; Males 70.8 j 66.9 170.7: 67.6 j 68.7 i 70.7 ! 71.1 j 68.1 i 71.4: 71.0 i ;Females 70.6 ! 71.3 : 72.4 75.0 : 76.0 ! 76.5 ; 77.1; 72.6 j 75.3: 73.6 j ; Both !Sexes 70.7 j 69.3 | 71.8 | 73.3 j 72.9 ! 74.3 | 74.3 | 70.5 | 73.3 : 72.6 \ ; England ;& Wales Mj65.1 j 67.1 67.3 ; 67.6 : 67.5 67.7 : 67.7 j 67.8 ! 68.0 j F .70.9 : 72.3 | 72.4: 73.1 i 72.9 73.3 ! 73.2 i 73.5 j 13.7 Expectation of Life On the basis of the mortality experience of the three years 1957-59 the expectation of life of a boy at birth is 68.0 years and of a girl 73.7 years. This compares with 48.43 and 52.38 on the basis of death rates for 1901-1910](https://iiif.wellcomecollection.org/image/b29200064_0013.jp2/full/800%2C/0/default.jpg)