Departmental report : 1999/2000 / Department of Health presented to Parliament by the Secretary of State for Health and the Chief Secretary to the Treasury.
- Great Britain. Department of Health
- Date:
- 2000
Licence: Attribution 4.0 International (CC BY 4.0)
Credit: Departmental report : 1999/2000 / Department of Health presented to Parliament by the Secretary of State for Health and the Chief Secretary to the Treasury. Source: Wellcome Collection.
133/180 (page 127)
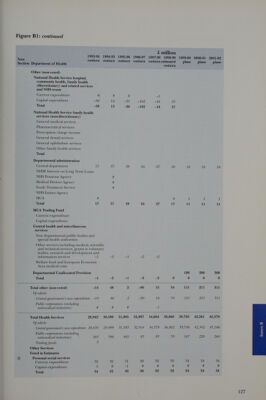
![£ million 1993-94 1994-95 1995-96 1996-97 1997-98 1998-99 1999-00 2000-01 2001-02 Vote outturn outturn outturn outturn i : outturn estimated lans 1 1. Section Department of Health outturn etait. omy Other (non-voted) National Health Service hospital, community health, family health (discretionary) and related services and NHS trusts Current expenditure # # # -l Capital expenditure -30 14 —35 -102 -10 37 Total -30 13 -36 -102 -10 37 National Health Service family health services (non-discretionary) General medical services Pharmaceutical services Prescription charge income General dental services General ophthalmic services Other family health services Total Departmental administration Central department iy 37 38 24 no ~I nok i=) 10 10 10 NHSE Interest on Long Term Loans NHS Pensions Agency # Medical Devices Agency # Youth Treatment Service # NHS Estates Agency MCA # 8 1 1 1 Total 17 37 38 24 27 17 11 11 11 MCA Trading Fund Current expenditure Capital expenditure Central health and miscellaneous services Non departmental public bodies and special health authorities Other services including medical, scientific and technical services, grants to voluntary bodies, research and development and information services -l -2 -l -2 -2 Welfare food and European Economic Area medical costs Departmental Unallocated Provision 100 200 300 Total -1 -2 -1 -2 -2 0 0 0 0 Total other (non-voted) -14 48 2 -80 15 54 111 211 311 Of which: Central government’s own expenditure —14 48 2 —80 16 54 111 PAN 31] Public corporations (excluding nationalised industries) # # # —I Total Health Services 28,942 30,590 31,985 32,997 34,664 36,860 39,703 42,561 45,370 Of which: Central government's own expenditure 28,634 29,999 31,585 32,914 34,579 36,802 39,536 42,342 45,106 Public corporations (excluding apron industries) 303 590 401 83 85 Bg: 167 220 264 Trading funds 2 Other Services Voted in Estimates 2) Personal social services Current expenditure aye oe Capital expenditure Total 34 32 30 30 52 32 34 34 34 au 30 32 OZ fi 34 34](https://iiif.wellcomecollection.org/image/b31857346_0133.jp2/full/800%2C/0/default.jpg)