Departmental report : 1999/2000 / Department of Health presented to Parliament by the Secretary of State for Health and the Chief Secretary to the Treasury.
- Great Britain. Department of Health
- Date:
- 2000
Licence: Attribution 4.0 International (CC BY 4.0)
Credit: Departmental report : 1999/2000 / Department of Health presented to Parliament by the Secretary of State for Health and the Chief Secretary to the Treasury. Source: Wellcome Collection.
137/180 (page 131)
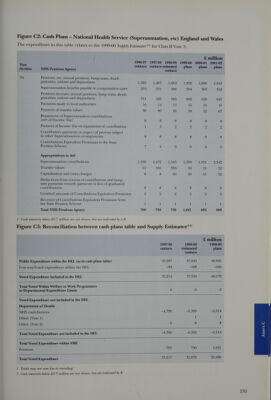
![Figure C2: Cash Plans — National Health Service (Superannuation, etc) England and Wales The expenditure in this table relates to the 1999-00 Supply Estimates®® for Class II Vote 3. £ million ae 1996-97 1997-98 1998-99 1999-00 2000-01 2001-02 ‘0 outturn outturn estimated 1 1 1 Section NHS Pensions Agency outturn Poe eke eee 3A Pensions, etc: annual pensions, lump sums, death gratuities, widows and dependants 1,385 1,497 1,653 1,832 1,886 1,943 Superannuation benefits payable in compensation cases 233 231 286 294 303 312 Pensions increase: annual pensions, lump sums, death gratuities, widows and dependants 511 526 565 606 626 645 Payments made to local authorities 16 14 13 15 15 15 Payment of transfer values 36 90 26 50 bo 67 Repayment of Superannuation contributions (net of Income Tax) 8 8 8 8 8 8 Payment of Income Tax on repayments of contributions 1 3 2 Contributory payments in respect of persons subject to other Superannuation arrangements # # # # # # Contributions Equivalent Premiums to the State Pension Scheme a 4 6 6 6 6 Appropriations in Aid Superannuation contributions 1,339 1,472 1,543 1,709 1,931 2,342 Transfer values 57 105 233 30 31 32 Capitalisation and extra charges # # 50 50 51 52 Deductions from returns of contributions and lump sum payments towards payments in lieu of graduated contributions # # # # # # Certified amounts of Contributions Equivalent Premiums 2 2 ve 2 2 2 Recovery of Contributions Equivalent Premiums from the State Pension Scheme 1 ] 1 1 1 1 Total NHS Pensions Agency 798 793 #30) 7515021 882 569 I Cash amounts below £0.5 million are not shown, but are indicated by a #. Figure C3: Reconciliation between cash plans table and Supply Estimates®* £ million 1997-98 1998-99 1999-00 outturn estimated plans outturn Public Expenditure within the DEL (as in cash plans table) 35,297 37,643 40,345 Less non-Voted expenditure within the DEL -84 -108 -166 Voted Expenditure included in the DEL 35,214 37,534 40,179 Total Voted Within Welfare to Work Programmes in Departmental Expenditure Limits 0 0 0 Voted Expenditure not included in the DEL Department of Health NHS contributions -4,790 5,393 pis Other (Vote 1) } : Other (Vote 2) # : Total Voted Expenditure not included in the DEL —4,790 —5,392 5,513 Total Voted Expenditure within AME i 793 730 1,021 Pensions ,686 Total Voted Expenditure 31,217 32,872 SD 1 Totals may not sum due to rounding. 2 Cash amounts below £0.5 million are not shown, but are indicated by #.](https://iiif.wellcomecollection.org/image/b31857346_0137.jp2/full/800%2C/0/default.jpg)