Departmental report : 1999/2000 / Department of Health presented to Parliament by the Secretary of State for Health and the Chief Secretary to the Treasury.
- Great Britain. Department of Health
- Date:
- 2000
Licence: Attribution 4.0 International (CC BY 4.0)
Credit: Departmental report : 1999/2000 / Department of Health presented to Parliament by the Secretary of State for Health and the Chief Secretary to the Treasury. Source: Wellcome Collection.
30/180 (page 24)
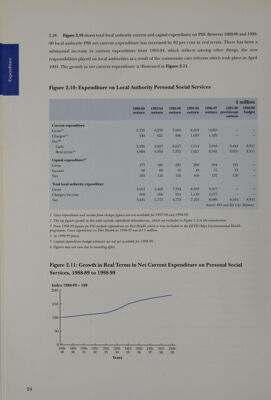
![99 local authority PSS net current expenditure has increased by 82 per cent in real terms. There has been a substantial increase in current expenditure from 1993-94, which reflects among other things, the new responsibilities placed on local authorities as a result of the community care reforms which took place in April 1993. The growth in net current expenditure is illustrated in Figure 2.11. Figure 2.10: Expenditure on Local Authority Personal Social Services £ million 1988-89 1993-94 199495 1995-96 1996-97 1997-98 1998-99 outturn outturn outturn outturn _outturn provisional budget outturn Current expenditure Gross) 3,776 6,278 7,503 8,393 9,263 - - Charges? 440 621 886 1,079 1,320 - = Net?) Cash 3,336 5,657 6,617 7,314 7,943 8,444 8,911 Real terms) 4,908 6.394 13315 7,921 8,345 8,655 8,911 Capital expenditure Gross 177 185 201 200 194 161 - Income 68 69 45 40 57 41 - Net 109 116 156 160 137 120 - Total local authority expenditure Gross 3,953 6,463 7,704 8,593 9,457 - - Charges/income 508 690 931 MEIN ee, 1,377 - - Net 3,445 tls 6,773 7,474 8,080 8,564 8,911 Source: RO and RA LAs’ Returns 1 Gross expenditure and income from charges figures are not available for 1997-98 and 1998-99. 2 The net figures quoted in this table exclude capitalised redundancies, which are included in Figure 1.2 in the introduction. 3 From 1998-99 figures for PSS exclude expenditure on Port Health which is now included in the DETR Other Environmental Health programme. Gross expenditure on Port Health in 1996-97 was £5.9 million. 4 At 1998-99 prices. 5 Capital expenditure budget estimates are not yet available for 1998-99. 6 Figures may not sum due to rounding effect. Figure 2.11: Growth in Real Terms in Net Current Expenditure on Personal Social Services, 1988-89 to 1998-99 Index 1988-89 = 100 200 150 100 50 0 1988- 1989- 1990- 1991- 1992- 1993- 1994 1995- 1996- 1997- 1998- 89 90 9] 92 93 94 95 96 97 98 99 Years 2%](https://iiif.wellcomecollection.org/image/b31857346_0030.jp2/full/800%2C/0/default.jpg)