[Report 1932] / Medical Officer of Health, Oldham County Borough.
- Oldham (England). County Borough Council. nb2004302054.
- Date:
- 1932
Licence: Attribution 4.0 International (CC BY 4.0)
Credit: [Report 1932] / Medical Officer of Health, Oldham County Borough. Source: Wellcome Collection.
106/146 page 98
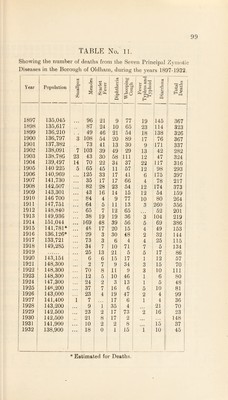
![TABLE No. 10. Showing the Birth-rates, also Rates of Mortality from all causes, from the seven principal Zymotic Diseases, and from Phthisis, Bronchitis, and Pneumonia, during the years 1900-1932 Tear RATES PER 1,000 POPULATION FROM Deaths under I year to 1000 Births Population [ 1 Births 1 Deaths all causes |7 principT j Zymotic , Diseases Phthisis Bron¬ chitis Pneu¬ monia 1900 136,797 27-1 220 2-7 1-9 2-8 2-3 173 1901 137,382 24-6 19-7 2-5 1-6 2-2 2-2 173 Average 5 y’rs 27‘0 20*9 2*5 1*7 2*4 2*3 180 1902 138,091 | 26-1 19-1 2-0 1-5 2-1 2-0 148 1903 138,786 25-6 18-6 2-4 1-6 2-4 1-6 160 1904 139,497 24-9 18.3 2-3 1-4 2-2 1-5 155 1905 140,225 24-3 18-1 2-1 15 1-9 1-6 150 1906 140,969 26-9 18-8 2-8 1-3 1*7 1-6 146 Average 5 y’rs 25*5 18-6 2-3 1*4 2*0 1*6 152 1907 141,730 26-5 19 3 15 1-6 2-5 1-9 144 1908 142,507 28-4 201 2-6 1-5 2-2 1-5 159 1909 143,301 27 4 190 11 1-4 2-2 1-8 119 1910 146,700 25-2 16-7 1-8 11 1-7 1-5 127 1911 147,751 24-4 18-2 2-5 1-2 1-7 1-5 159 Average 5 y’rs 26‘4 18-6 1*9 13 2-0 1-6 141 1912 148,840 22-9 16 3 13 1-3 1-8 13 117 1913 149,936 23-2 17-1 1-4 1-2 2 0 13 139 1914 151,044 23-0 17-8 2-5 1-2 1-9 1-4 136 1915 141,781 20 8 18-0 10 1-4 2-3 16 126 1916 *136 126 17-8 16-7 0-9 1-3 1-8 0-9 122 Average 5 y’rs 2D5 17*2 1*4 1-3 1‘9 1-3 128 1917 *133,721 14'4 16-0 0-8 1-3 2-1 1-3 110 1918 149,285 13-8 21-1 10 1-2 2-7 2-3 118 1919 . 15-7 16-0 0-6 09 2-2 11 95 1920 143,154 23 6 15 0 0-4 1-1 1-6 1-2 105 1921 148,300 21-3 14-8 0-5 0-8 1-7 1-2 109 Avera ge 5 y’rs 17 7 16-6 0 6 M 2 1 1-4 107 1922 148,300 19 3 15-8 0-7 0-9 2-0 1-2 106 1923 148,300 17 8 160 0-5 0-8 2-2 1-5 no 1924 147,300 16-3 13 7 0-3 0-8 1-7 1-2 in 1925 146,200 15-5 14-8 0-5 0-8 1-7 1*1 103 1926 143,000 16-1 16-0 0-7 0-8 1-9 1-4 106 Average 5 y’rs 17*0 15*2 0*5 0*8 1*9 1*3 107 1927 141,400 14 6 14 4 0-2 0-7 1-7 1-2 86 1928 143,200 14 1 14-4 0-4 0-8 1-6 0-9 88 1929 142,500 13-2 18 5 0-86 1-0 2-5 1-7 117 1930 142,500 13 3 13-7 0-3 0-7 1-6 1-0 70 1931 141,900 13-5 14-3 | 0-2 0-7 1-8 1-4 105 Average 5 y’rs 13*7 15*0 03 07 1*8 1*2 93 1932 138,900 12-8 I 1 1 13.9 ]_ 0-2 0.7 1-3 11 83](https://iiif.wellcomecollection.org/image/b2993705x_0106.jp2/full/800%2C/0/default.jpg)