[Report 1967] / Medical Officer of Health, Ince-in-Makerfield U.D.C.
- Ince-in-Makerfield (England). Urban District Council.
- Date:
- 1967
Licence: Attribution 4.0 International (CC BY 4.0)
Credit: [Report 1967] / Medical Officer of Health, Ince-in-Makerfield U.D.C. Source: Wellcome Collection.
8/32 page 6
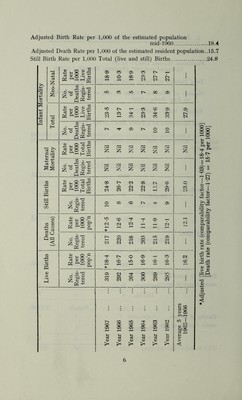
![Adjusted Birth Rate per 1,000 of the estimated population mid-1960 18.4 Adjusted Death Rate per 1,000 of the estimated resident population.. 15.7 Still Birth Rate per 1,000 Total (live and still) Births 24.8 Infant Mortality Neo-Natal Rate per 1000 Live Births 18-9 10-3 05 oo cp cb CM CM CM 1 No. of Deaths Regis- tered <n CO m 00 05 1 Total Rate per 1000 Live Births 23-5 137 34T 23*3 34*6 33*9 ! 27.9 No. of Deaths Regis- tered rji 05 o o i Maternal Mortality Rate per 1000 Total Births Nil Nil 2 Nil 1 Nil 2 2 No. of Deaths Regis- tered Nil Nil ! Nil Nil Nil 2 i Still Births Rate per 1000 Total Births 24-8 r>. cb CM 22-2 22*8 13.7 CO 05 CM i i O'So | — 1 No. Regis- tered © 00 CO in Tj- 05 Deaths (All Causes) Rate per 1000 pop’n in CM * 12-6 12-4 11-4 11-9 12-1 ! 12.1 No. Regis- tered 217 , 220 218 203 215 219 1 Live Births Rate per 1000 pop’n rh 00 * cb : 15-0 16-9 16-1 16-3 16.2 No. Regis- tered 05 r-H CO 292 1 CO CM 300 289 295 1 • * • 52 co • • • • cd co 0> 05 CO m Tf CO CM m | CO CO co CO CO CO CM 05 05 05 05 05 05 0) CO r—< i—i i—i T—1 i—1 i-i (-4 i-t t* l-l u 1-4 1-1 cd cd cd CO cd cd 05 O) <u 05 <u 05 0) > >< >< kH <2 Adjusted [live birth rate (comparability factor—1*03) = 18-4 per 1000] [Death rate (comparability factor—1-27) = 15-7 per 1000]](https://iiif.wellcomecollection.org/image/b29495593_0008.jp2/full/800%2C/0/default.jpg)