The Fernley Observatory, Southport : report and results of observations for the year 1904 / Borough of Southport Meteorological Department.
- Southport (England). County Borough Council. Meteorological Department.
- Date:
- 1905
Licence: Attribution 4.0 International (CC BY 4.0)
Credit: The Fernley Observatory, Southport : report and results of observations for the year 1904 / Borough of Southport Meteorological Department. Source: Wellcome Collection.
17/34 (page 15)
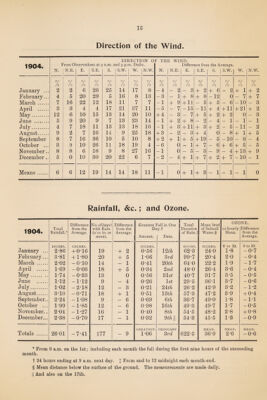
![Direction of the Wind. 1904. i N. >001 0' N.E. iservati E. ons at c S.E. a.m. a S. DII nd 9 p.i S.W. IECTI n. Dail W. ON 0 y* N.W. F TH N. E WII N.E. m Differe E. nee froi S.E. n the A S. verage. S.W. w. N.W. °/ o/ Of Of °/ o/ Of Of Of Of Of c / Of of o /o /o /o /o /o /o /o /o /o /o /o /o o /o /o o January ... 2 2 6 26 25 14 17 8 -4 - 2 - 3 + 2 + 6 - 2 + 1 + 2 February... 4 5 20 29 5 16 8 13 -3 - 1 + 8 + 8 — 12 0 - 7 + 7 March. 7 16 22 12 18 11 7 7 -1 + 9 + 11 - 5 + 5 - 6 -10 — 3 April . 3 3 4 4 17 21 37 11 -5 - 7 -15 -11 + 4 + 11 + 21 + 2 May. 12 6 10 15 13 14 20 10 + 4 - 3 - 7 + 5 + 2 + 2 0 — 3 June . 5 9 20 9 7 13 23 14 -1 + 2 + 8 - 2 — 4 - 1 - 1 — 1 July. 4 7 18 11 13 13 18 16 -1 + 3 + 11 + 3 + 2 - 5 -11 — 2 August. 9 2 7 16 14 9 25 18 + 3 - 2 - 3 + 4 0 - 8 + 1 + 5 September 8 7 16 36 10 5 10 8 + 2 + 1 + 5 + 19 — 5 -10 - 8 — 4 October ... 3 9 10 26 11 18 19 4 -6 0 - 1 + 7 — 6 + 6 + 5 — 5 November.. 8 8 6 18 9 8 27 16 -1 0 - 5 - 3 — 9 - 4 + 13 + 9 December .. 5 0 10 30 20 22 6 7 -2 - 4 + 1 + 7 + 2 + 7 -10 — 1 Means. 6 6 12 19 14 14 18 11 -1 0 + 1 + 3 — 1 - 1 - 1 0 Rainfall, &c.; and Ozone. 1904. Total Rainfall.* Difference from the Average. No. ofdayst with Rain (o'oi in. or more). Difference from the Average. Greatest ] Da Amount. all in One Date. Total Duration of Rain.J Mean level of Subsoil Water. § 02C 12-hourly Mean. INE. Difference from the Average. January ... INCHES. INCHES. INCHES. HOURS. INCHES. 0 to 10. 0 to 10. 2*86 + 0-16 19 ' + 2 0’56 12 th 62-3 24-0 1-8 -0-7 February... 3*81 + 1*80 20 + 5 1-06 3rd 99-7 20-4 2-0 -0-4 March. 2*02 -0*10 14 — 1 0-41 20th 64-0 22-2 1-9 -1-7 April . 1-69 -0-03 18 + 5 0-34 2nd 48-0 26-4 3-6 -0-4 May. 1*74 -0*33 13 0 0-56 31s£ 40-7 31-7 3-5 -0-5 J une . 1-12 -1-12 9 — 4 0-26 1st 29-5 36-1 3-7 -0-6 July. 1-02 -2-18 12 — 3 0*21 2m 26-2 42-9 3-2 -1-2 August. 3*10 -0*71 18 + 1 0-51 13 th 57-3 47-2 3-9 + 0*4 September.. 2-24 -1-08 9 — 6 0-69 6 th 36-7 49-0 1-8 -1-1 October ... 1*99 -1*85 12 — 6 0-98 16th 49-3 49-7 1-7 -0-5 November.. 2-04 -1-27 16 — 1 0*40 8th 54-5 48-2 2-8 + 0-8 December... 2-38 -0-70 17 — 1 0-32 9th || 54-3 45-5 1-3 -0-9 Totals . 26-01 -7*41 177 — 9 GREATEST. 1-06 FEBRUARY 3rd 622-5 MEAN. 36-9 MEAN. 2-6 MEAN. -0-6 * From 9 a.m. on the 1st; including each month the fall during the first nine hours of the succeeding month. t 24 hours ending at 9 a.m. next day. j From and to 12 midnight each month-end. § Mean distance below the surface of the ground. The measurements are made daily. || And also on the 17th.](https://iiif.wellcomecollection.org/image/b30640635_0017.jp2/full/800%2C/0/default.jpg)