The Fernley Observatory, Southport : report and results of observations for the year 1904 / Borough of Southport Meteorological Department.
- Southport (England). County Borough Council. Meteorological Department.
- Date:
- 1905
Licence: Attribution 4.0 International (CC BY 4.0)
Credit: The Fernley Observatory, Southport : report and results of observations for the year 1904 / Borough of Southport Meteorological Department. Source: Wellcome Collection.
18/34 (page 16)
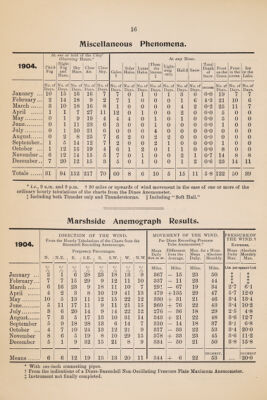
![Miscellaneous Phenomena. 1904. At Thick Fog one or Ohser Slight Fog and Haze. both o: ving H Sky Haze. the C, ours.* Clear Air. kief Clear Sky. Gales. t Solar Halos. Lunar Halos. Thun¬ der Storms t At Light¬ ning only. any H Hail. § our. Snow. Total Depth of Snow. Frost on the Grass. Frost in the screen Ice on the Lake. No. of No. of No. of No. of No. of No. of No. of No. of No. of No. of No. of No. of No. of No. of No. of January ... Days. Days. Days. Days. Days. Days. Days. Days. Days. Days. Days. Days. Days. Days. Days. 10 15 16 16 7 7 0 1 0 1 3 0 0*0 19 7 7 February... 2 14 18 9 2 7 1 0 0 0 1 6 4*3 21 10 6 March. 8 10 18 16 8 1 0 0 0 0 4 2 0-2 25 11 7 April . 1 1 7 27 11 12 0 1 0 0 2 0 0-0 5 0 0 May. 0 1 9 19 4 4 4 0 1 0 1 0 0-0 5 0 0 June. 0 1 11 23 6 3 0 0 -1 1 0 0 0 0-0 1 0 0 July. 0 1 10 21 6 0 0 0 4 0 0 0 o-o 0 0 0 August. 0 2 8 25 7 6 2 0 2 2 0 0 o-o 0 0 0 September.. 1 5 14 12 7 2 0 0 2 1 0 0 o-o 1 0 0 October ... 1 12 15 19 4 6 1 2 0 1 1 0 o-o 8 0 0 November.. 6 12 14 15 5 7 0 1 0 0 2 1 0*7 14 8 8 December.. 7 20 12 15 3 5 0 1 0 0 1 2 0*6 23 14 11 Totals . 31 94 152 217 70 60 8 6 10 5 15 11 5*8 122 50 39 * i.e., 9 a.m. and 9 p.m. + 30 miles or upwards of wind movement in the case of one or more of the ordinary hourly tabulations of the charts from the Dines Anemometer. + Including both Thunder only and Thunderstorms. § Including “ Soft Hail.” Marshside Anemograph Results. 1904. DIRECTIC From the Hourly T Baxendell Freq N. N.E. ( E. )N OI abulath Recorc uency 1 S.E. THI ms of tl .ing An 3ercent£ S. : wii ie Char emosco] rges. S.W. 4D. ts from the re. W. - N.W. MOVE Per Mean Daily Mcmmmt. MENT O Dines Rec Tube Ane Difference from the Average. F THE ording Pre; mometer.* Max. fo Mean Daily. WIND. ;sure r i Hour. Absolute Monthly. PRESS! THE \ Extr Mean Daily Max. JREOF VIND. t ernes. Absolute Monthly Max. 7 /o °/ /o o/ /o 0/ /o 7 /o Of /o 7 /o 0/ /o Miles. Miles. Miles. Miles. Lbs. per square foot January ... 2 1 6 28 23 18 13 9 367 - 15 23 50 t t February... 7 7 15 29 9 12 11 10 337 - 11 23 44 t t March. 6 16 23 9 18 11 10 7 291 - 67 19 34 2*7 6-1 April . 4 2 3 8 10 19 41 13 479 + 135 29 47 5-7 120 May. 10 5 13 11 12 15 22 12 330 f 31 21 46 3*4 13-4 June. 5 11 17 11 9 11 21 15 360 + 76 22 43 3-4 10-2 July. 3 6 20 14 9 14 22 12 276 - 36 18 29 2-5 4-8 August. 7 3 5 17 13 10 31 14 343 + 21 22 48 3-6 12-7 September 5 9 18 28 13 6 14 7 310 - 14 18 37 3*1 6-8 October ... 4 7 10 24 13 12 21 9 317 - 33 22 53 3-4 200 November 8 6 5 19 8 10 29 15 378 + 33 23 45 3*6 11-2 December 5 1 9 32 15 21 8 9 334 - 50 21 50 3-8 15-8 HIGHEST. HIGHEST Means. 6 6 12 19 18 13 20 11 344 + 6 22 53 • . . 20-0 * With one-inch connecting pipes. f From the indications of a Dines-Baxendell Non-Oscillating Pressure Plate Maximum Anemometer. X Instrument not finally completed.](https://iiif.wellcomecollection.org/image/b30640635_0018.jp2/full/800%2C/0/default.jpg)