Typhoid fever in Michigan in 1890 : a summary from reports by health officers, clerks and physicians / compiled under the direction of the secretary of the Michigan State board of health.
- Michigan. Department of Health
- Date:
- 1893
Licence: Public Domain Mark
Credit: Typhoid fever in Michigan in 1890 : a summary from reports by health officers, clerks and physicians / compiled under the direction of the secretary of the Michigan State board of health. Source: Wellcome Collection.
Provider: This material has been provided by the Augustus C. Long Health Sciences Library at Columbia University and Columbia University Libraries/Information Services, through the Medical Heritage Library. The original may be consulted at the the Augustus C. Long Health Sciences Library at Columbia University and Columbia University.
9/42
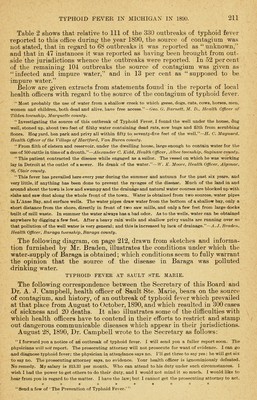
![TYPHOID FEVER IN MICHIGAN DURING THE YEAR ENDING DECEMBER 31, 1890, r Reprinted from the Annual Report of the Michigan State Board of Health for the year 1891.] [Repeint No. 382.] There were reported to the office of the Secretary of the Michigan State Board of Health, during the year 1890, 1,924 cases of sickness, and 304 deaths from typhoid fever, in 310 localities. No reports of this disease were received from the following sixteen counties: Alcona, Alger, Arenac, Crawford, Gratiot, Iosco, Iron, Isle Royal, Luce, Mackinac, Manitou, Missaukee, Montmorency, Ogemaw, Presque Isle, Schoolcraft. Table 1 gives, relative to typhoid fever, the number of outbreaks, local- ities, cases, and deaths, average number of cases per outbreak, average number of deaths per outbreak, per cent ratio of deaths to cases, and the number of special final reports received, for the seven years, 1884-90: Table 1.—Typhoid pevee.—Exhibiting the numher of Outbreaks, Localities. Cases and Deaths reported for each of the seven years, 1884-90; also for some of those years the average Cases and Deaths per Outbreak, the per cent ratio of Deaths to Cases, and the number of Special Final reports received. Year. Outbreaks Reported. Localities Reported. Cases Reported. Deaths Reported. Average Cases per Outbreak. Average Deaths per Outbreak. Deaths per 100 Cases. Final Reports Received. 1884 245 200 282 320 296 398 310 969 715 1,194 3,424 1,511 2,530 1,924 290 194 282 411 310 402 304 27 23 18 ■17 21 tl8 16 1885 1886 1887 1888 '_ 1886 1890 218 290 335 316 432 330 3.28 4.15 *7.24 4.78 t5.17 5.83 .89 .75 *1.23 .98 t.98 .92 60 46 60 1 115 135 * The large average number of cases and deaths per outbreak in 1887 is partially accounted for by the fact that in two outbreaks the disease became epidemic, resulting in an aggregate of 535 cases and 7S deaths. t In computing the average numbers of cases and deaths per outbreak, and the per cent ratio of deaths to cases in 1889, the outbreak at Negaunee, in -which 300 cases were reported, is omitted, because the number of deaths which occurred in that outbreak was not reported. As shown in Table 1 there were reported to this office 606 cases and 98 deaths less for the year 1890 than for the preceding year. The average number of cases per outbreak for the year 1890 is slightly more than for 1889. This is explained in part by the fact that, during the year 1889, 27](https://iiif.wellcomecollection.org/image/b21229983_0009.jp2/full/800%2C/0/default.jpg)


 No text description is available for this image
 No text description is available for this image
 No text description is available for this image