On certain changes in the English rates of mortality / by Thomas A. Welton.
- Welton, Thomas A. (Thomas Abercrombie), 1835-1918
- Date:
- 1880
Licence: Public Domain Mark
Credit: On certain changes in the English rates of mortality / by Thomas A. Welton. Source: Wellcome Collection.
Provider: This material has been provided by The Royal College of Surgeons of England. The original may be consulted at The Royal College of Surgeons of England.
17/36 page 77
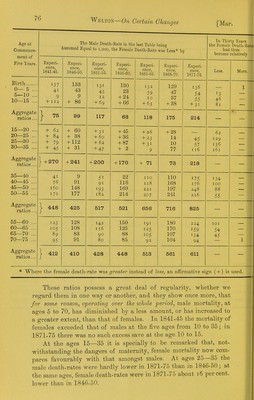
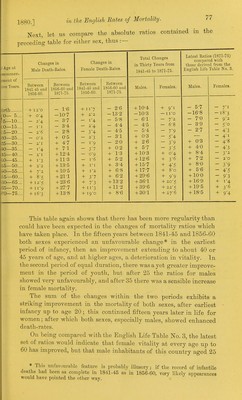
![1880.] Next, let us compare the absolute ratios contained in the preceding table for either sex, thus :— lirtli 0— 5... 5—10... ,0—15... -.5—20... iO—25... 35—30... 110—35.... L15—40... 11,0—45... 3,5—50... iO—55... 55—60... 50—65... 35—70... ?0—75... Changes in Male Death-Rates. Between 1841-45 and 1856-60. + I2'0 + 0'4 — 2'4 — II — 2-6 — 0'2 — Z'l — i4 — 2! + 13 + + + + ii'5 + 119 + i6-3 Between 1856-00 and 1871-75. 7'J 8-5 - 1-6 -10-7 - 3-7 - 3-4 - 2-8 + 0-5 + 4-7 + 71 -I-12-4 -Hl-3 -f 10-5 + 21-1 -f23-6 + 27-7 + 13-8 Changes in Temale Deatli-Rates. Between 1841-45 and 185G-60. + + 2-2 - i'4 - 2-4 - 34 - 2-3 - 1-9 - 3'7 - 0-9 - 1-6 I'2 37 7'3 ii3 i9'o Between 1856-60 and 1871-75. - 2-6 -13-2 - 5-8 - 4-4 - 4'5 - 31 - 20 0- 2 1- 3 5- 2 3-4 6- 8 6-2 -1-13-2 + 11-2 + 8-6 Total Changes in Thirty Years from 1841-45 to 1871-75. Males. + 10-4 -10-3 - 61 - 4-5 - 5-4 -1- 0-3 -1- 2-6 + 5-7 -1-10-3 -I-12-6 -1-15-7 + 17-7 -f29-6 -I-36-1 -1-39-6 -1-30-1 Females. + 9i - I i-o - 7-2 - 6-8 - 7-9 - 54 - 39 - 3'5 0-4 3-6 4'5 8-0 9'9 + 20-5 + 22-5 + 27-6 Latest Ratios (1871-75) compared with those derived from the English Life Table No. 3. Males. - 5-7 -16-8 - 7-0 - 3-9 - 2-7 0-3 4- 0 8-4 7- 2 8- 0 5- 6 -1-100 + 16-9 -1-19-5 -*-18-5 Females. - 7'l -18-3 - 9-2 - 5'o - 43 - 4'i - 4-8 - 4'3 - 3'2 - 2-0 - 3'9 - 4'5 - 9'3 + ^-4 + 3-6 + 9'4 This table again shows that there has been more regularity than could have been expected in the changes of mortality ratios -which have taken place. In the fifteen years bet-ween 1841-46 and 1856-60 both sexes experienced an unfavourable change* in the earliest period of infancy, then an improvement extending to abont 40 or 45 years of age, and at higher ages, a deterioration in vitality. In the second period of equal duration, there was a yet greater improve- ment in the period of youth, but after 25 the ratios for males showed very unfavourably, and after 35 there was a sensible increase in female mortality. The sum of the changes within the two periods exhibits a striking improvement in the mortality of both sexes, after earliest infancy up to age 20; this continued fifteen years later in life for women; after which both sexes, especially males, showed enhanced death-rates. On being compared with the English Life Table No. 3, the latest set of ratios would indicate that female vitality at every age up to 60 has improved, but that male inhabitants of this country aged 25 * This uiifiivourablc feature is probably illusory; if tbe record of infantile deaths had been as complete in 1841-45 as in 1856-60, very likely appearances would have pointed the other way.](https://iiif.wellcomecollection.org/image/b22273268_0017.jp2/full/800%2C/0/default.jpg)
 No text description is available for this image
 No text description is available for this image
 No text description is available for this image