[Report 1915] / Medical Officer of Health, Nottinghamshire County Council.
- Nottinghamshire County Council
- Date:
- 1915
Licence: Attribution 4.0 International (CC BY 4.0)
Credit: [Report 1915] / Medical Officer of Health, Nottinghamshire County Council. Source: Wellcome Collection.
75/96 (page 73)
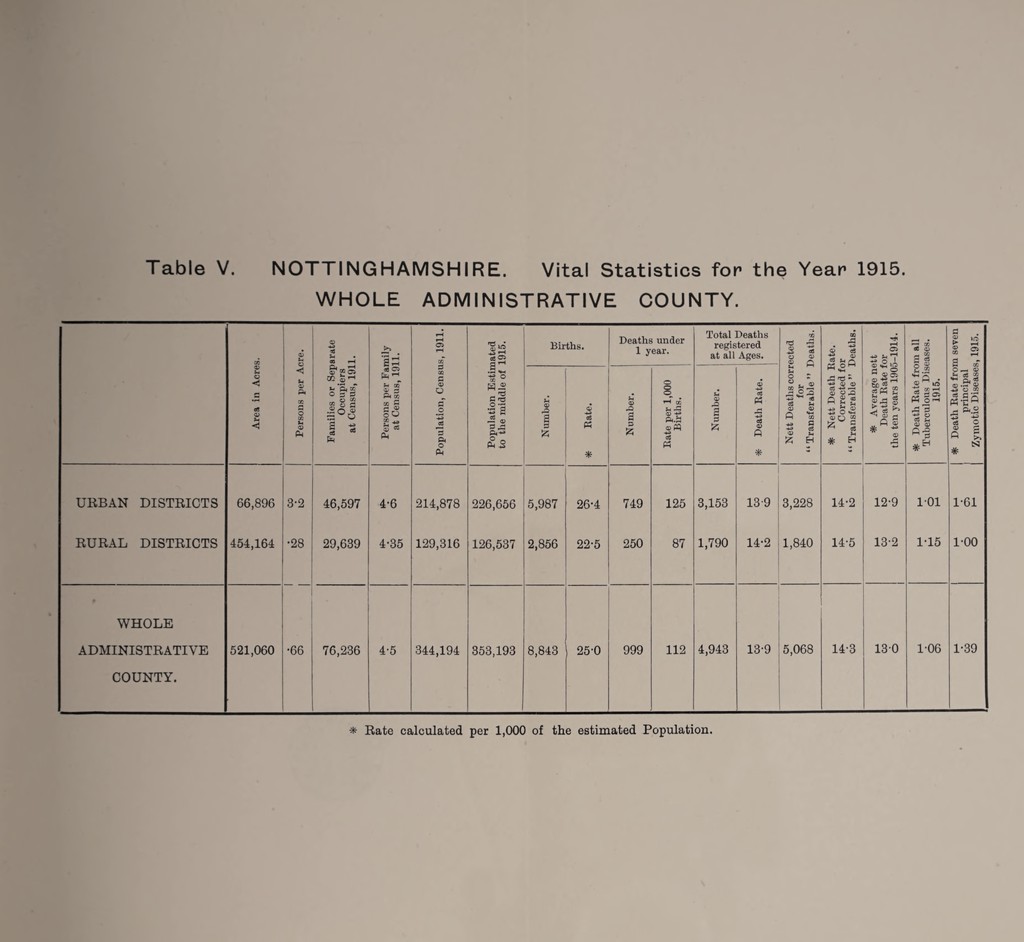
![WHOLE ADMINISTRATIVE COUNTY. 05 © U © -sJ CD i-H a 3 rH 05 rH in Population Estimated to the middle of 1915. Births. Deaths under 1 year. Total Deaths registered at all Ages. ected Deaths. * Nett Death Rate. Corrected for “Transferable” Deaths. Hi rH 05 H3 U *3 ® ce <u CO h H Si 1 2 & S Area in Acre < U © P< OC o 00 u © Ph Families or Sep Occupiers at Census, 191 «8 05 fe’-' g i ft a: CO C ® oO £ ^ ft S 00 e* © rj .2 -4-J c6 a O P Number. © c6 PH * Number. j Rate per 1,000 Births. Number. # Death Rate. Nett Deaths corr for “ Transferable ” ] H O M © 05 © rH tc ^ -- gP3 £ Z* s 5 -S ^2 a P © # ■*» © # Death Rate frc Tuberculous Disi 1915. 1 * Death Rate froi principal | Zymotic Diseases URBAN DISTRICTS 66,896 3-2 46,597 4-6 214,878 226,656 5,987 26*4 749 125 3,153 13-9 3,228 14-2 12-9 101 1-61 RURAL DISTRICTS 454,164 •28 29,639 4-35 129,316 126,537 2,856 22-5 250 87 1,790 14-2 1,840 14-5 13-2 1-15 1-00 WHOLE ADMINISTRATIVE 521,060 •66 76,236 4-5 344,194 353,193 8,843 25-0 999 112 4,943 13-9 5,068 14-3 130 1-06 1-39 COUNTY. * Rate calculated per 1,000 of the estimated Population.](https://iiif.wellcomecollection.org/image/b29925125_0075.jp2/full/800%2C/0/default.jpg)