[Report 1951] / Medical Officer of Health, North Riding of Yorkshire County Council.
- North Riding of Yorkshire (England). County Council.
- Date:
- 1951
Licence: Attribution 4.0 International (CC BY 4.0)
Credit: [Report 1951] / Medical Officer of Health, North Riding of Yorkshire County Council. Source: Wellcome Collection.
70/78 (page 66)
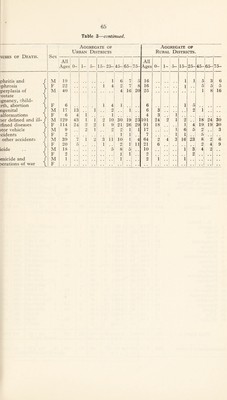
![TABLE 4. Deaths in Sanitary Districts from the seven chief causes, 1951. Cancer. Heart disease. Respiratory non¬ tuberculosis. Tuber¬ culosis- Pulmonary. Tuberculosis non- pulmouary. Other circulatory disease. Vascu lesions nervo systei DISTRICT No. Death rate per 1,000 population. No. Death rate per 1,000 po pulation. No. Death rate per 1,000 population. No. Death rate per 1,000 population. No. Death rate per 1,000 population. No. Death rate per 1,000 population. No, A.—Urban. 1. Eston 52 1-57 113 3-41 54 1-63 14 •42 17 •51 44 1 2. Guisborough 13 1-52 36 4-21 13 1-52 • . . . . . • . 2 •23 20 2 3 Loftus 14 1-91 28 3-8] 11 1-50 1 •14 1 •14 1 •14 17 2 4. Malton • • 7 1-67 18 4-30 4 •96 1 •24 . . . . 9 Lu •48 11 2 5. Northallerton 8 1-39 29 5-02 8 1-39 • . • . . . . . 1 •17 13 2 6. Pickering 14 3-24 20 4-63 4 •93 . . . . . . . . 1 •23 8 1 7. Redcar 48 1-76 147 5-39 25 •92 3 •11 . . , . 7 •26 45 1 8. Richmond . . 16 2-53 18 2-85 5 •79 2 •32 . . . « 2 •32 10 1 9. Saltburn and Marske 19 2-24 50 5-90 15 1-77 1 •12 2 •24 4 •47 12 1 10. Scalby 14 2-26 45 7-28 4 •65 2 •32 1 •16 . . . . 16 2 11. Scarborough 109 2-50 321 7-35 36 •82 7 •16 1 •02 15 •34 74 1 12. Skelton & Brotton 23 1-78 55 4-25 4 •31 • . . . . . . . 7 •54 20 1 13. Thornabv-on-Tees 46 1-97 82 3-51 49 2-10 6 •26 3 •13 15 •64 31 1 14. Whitby 20 1-73 70 6-06 19 1-64 1 •09 1 •09 3 •26 50 4 Total Urban 403 1-98 1032 5-08 251 1-24 38 •19 9 •04 77 •38 371 B.—Rural. 1. Aysgarth 4 M3 20 5-66 4 M3 1 •28 1 •28 3 •85 11 3 2. Bedale 11 1-38 21 2-63 7 •88 . . . . . . 7 •88 17 2 3. Croft 4 1-55 13 5-03 2 •77 . . . , . . . . . . 5 1 4. Easingwold . . 20 1-64 49 4-03 7 •58 1 •08 1 •08 3 •25 22 1 5. Flaxton 32 1-57 58 2-84 13 •64 5 •24 . . 12 •59 29 1 6. Helmsley 5 •91 30 5-48 2 •37 . . . . 3 •55 10 1 7. Kirbymoorside 1-46 26 5-43 3 •63 . . . . 7 1-46 12 2 8. Leyburn 7 1-08 29 4-49 3 •46 5 •77 4 •62 12 1 9. Malton 8 1-42 31 5-49 3 •53 1 •18 . . 5 •88 11 1 10. Masham 1 •60 16 9-65 1 •60 . . . . . , 1 •60 5 3 11. Northallerton 8 •95 38 4-51 7 •83 2 •24 . , 3 •36 7 12. Pickering 11 2-12 33 6-36 5 •96 . . . . . . 7 1-35 14 2 13. Reeth 5 2-45 8 3-92 3 1-47 . . . . 1 •49 6 2-94 7 3 14. Richmond . . 18 •59 35 1-16 13 •43 1 •03 1 •03 10 •33 19 15. Scarborough 14 1-63 49 5-72 5 •58 1 •12 . . • . 1 •12 16 1 16. Startforth 9 2-10 14 3-26 2 •47 . . . . . . . . 3 •70 12 2 17. Stokesley 34 1-93 63 3-57 16 •91 6 •34 2 •11 4 •23 30 1 18. Thirsk 24 1-75 67 4-89 17 1-24 8 •58 1 •07 8 •58 18 1 19. Wath 3 •90 4 1-20 4 1-20 . • , . . . 2 •60 5 1 20. Whitby 18 1-54 63 5-40 9 •77 1 •09 • • 6 •51 46 q Ci Total Rural • • 243 1-38 667 3-79 126 •72 32 •18 7 •04 95 •54 308 ! 1](https://iiif.wellcomecollection.org/image/b2991470x_0070.jp2/full/800%2C/0/default.jpg)