[Report 1919] / Medical Officer of Health, Manchester City.
- Manchester (England). City Council. n 88637066.
- Date:
- 1919
Licence: Attribution 4.0 International (CC BY 4.0)
Credit: [Report 1919] / Medical Officer of Health, Manchester City. Source: Wellcome Collection.
300/307 page 269
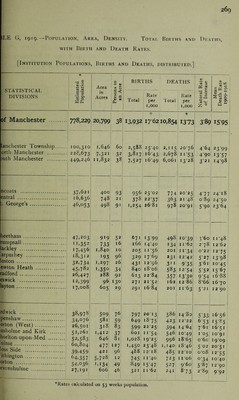
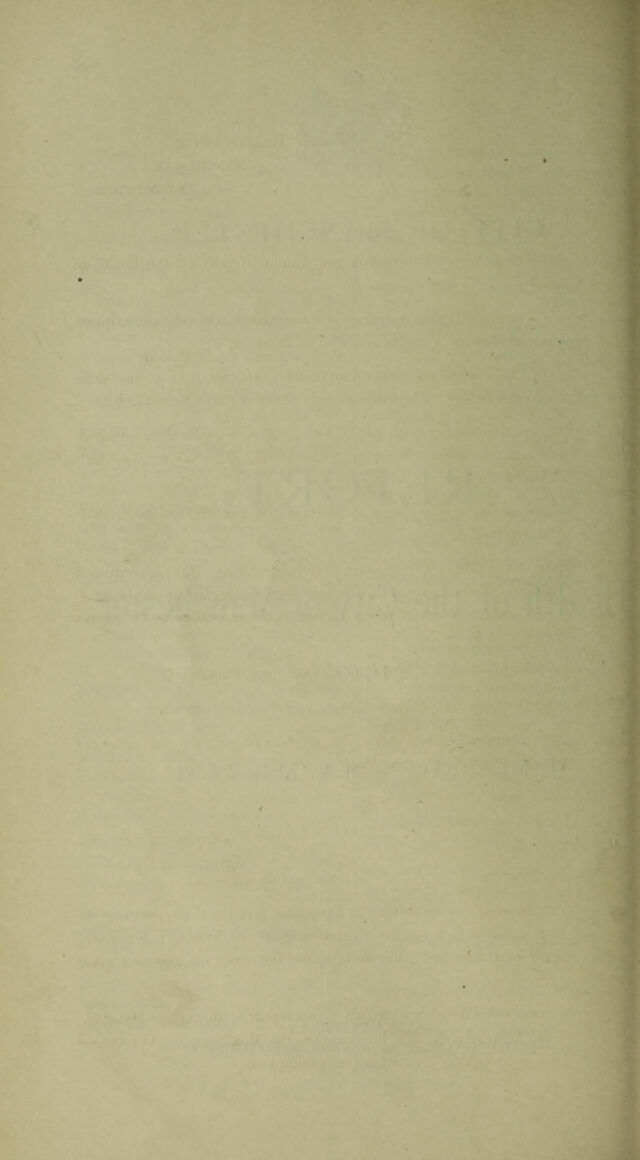
![ILE G, 1919.— Population, Area, Density. Total Births and Deaths, with Birth and Death Rates. [Institution Populations, Births and Deaths, distributed.] STATISTICAL DIVISIONS _ Estimated Population Area in Acres Persons to an Acre BIRTHS DEATHS Rate Rate Total per Total per 1,000 1,000 Natural Rate of Increase Mean Death Rate 1909-1918 of Manchester . 778,229 20,799 ' * * 38 13,932 176210,854 1373 3 89 i5‘95 [anchester Township. orth Manchester . >uth Manchester . 100,310 228,673 449,246 1,646 7,321 11,832 60 32 38 2,588 3,817 7,527 ' 25’4° i6‘43 16-49 2,115 2,678 6,061 j 2076 1 >‘53 13'28 4-64 4-9° 3'2I 2399 13'5 7 14-98 ncoats . entral . George’s. 37-621 16,636 46,053 400 748 498 93 21 9' 956 378 1,254 25-02 22-37 2681 774 363 978 * 20-25 21 -48 20-91 4 ‘ 7 7 089 5'90 24-18 24'5° 23-64 heetham. rumpsall. lackley . arpuihey . loston . ewton Heath . rad ford .. eswick . layton. 47.203 1 r>352 17,456 18,312 32,734 45,782 26,427 12,399 17,008 919 733 1,840 r93 1,297 1,35° 288 96 605 • 52 16 10 96 26 34 92 130 29 671 166 205 329 431 840 613 271 29 I 1 13’99 I4'4° n-56 1769 12-96 1806 22-84 2152 1684 — 498 *34 201 23l 3'1 583 357 162 201 10- 39; 3'6o 11- 62 278 11- 34 0'22 12- 42 5-27 9’35 3'6i 1254 5'52 !3‘3o; 9‘54 1286 8-66 11-63 5'2i 11 -48 1262 12- 75 13- 98 10-45 1567 16 ‘88 16-70 1290 rdwick . penshaw. orton (West). usholme and Kirk . liorlton-upon-Med . ulme. oss Side . ithington .. orton . evenshulme . 38,978: 34,076 26,501 51,261 52,583 60,804 39,459 64,357 54,036 27,191 509 581 3l8 1,412 646 477 421 5,728 M34 606 76 59 83 37 81 127 96 12 49 46 797 649 599 601 1,028. 1,45° 488 745 849 321 2012 i875 22'2c: 11 '54 19'25 3 3'48 I2-l8 11 -40 15 ‘47 1162 586 423 394 546 996 1,140 485 723 527 241 1 H'So 5-33 12*22 672 1464 7'6i 10-49 1-05 18-65 o'6c' 18-46 502 12*10 o-o8 11 06 o34 9-60' 3-87 8-73 2-89 16-56 I5‘85 16-51 10-91 19- 09 20- 51 I255 10-40 12-90 9-92 *Rates calculated on 53 weeks population.](https://iiif.wellcomecollection.org/image/b29785406_0301.jp2/full/800%2C/0/default.jpg)