Annual report of the Department of Public Health, Province of Alberta.
- Alberta. Department of Public Health
- Date:
- [1950]
Licence: Public Domain Mark
Credit: Annual report of the Department of Public Health, Province of Alberta. Source: Wellcome Collection.
203/306 page 9
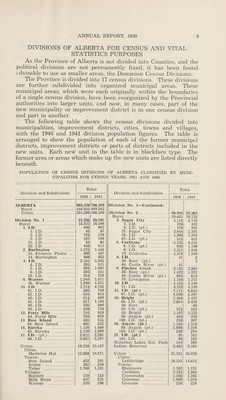
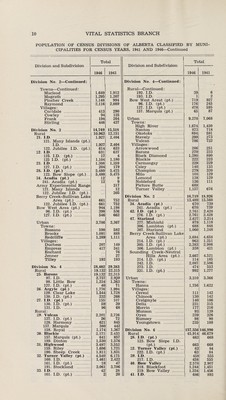
![DIVISIONS OF ALBERTA FOR CENSUS AND VITAL STATISTICS PURPOSES As the Province of Alberta is not divided into Counties, and the political divisions are not permanently fixed, it has been found c dvisable to use as smaller areas, the Dominion Census Divisions. The Province is divided into 17 census divisions. These divisions are further subdivided into organized municipal areas. These municipal areas, which were each originally within the boundaries of a single census division, have been reorganized by the Provincial authorities into larger units, and now, in many cases, part of the new municipality or improvement district is in one census division and part in another. The following table shows the census divisions divided into municipalities, improvement districts, cities, towns and villages, with the 1946 and 1941 division population figures. The table is arranged to show the population of each of the former municipal districts, improvement districts or parts of districts included in the new units. Each new unit in the table is in blackface type. The former area or areas which make up the new units are listed directly beneath. POPULATION OF CENSUS DIVISIONS OF ALBERTA CLASSIFIED BY MUNI¬ CIPALITIES FOR CENSUS YEARS, 1941 AND 1946 Division and Subdivision Total Division and Subdivision 1 Total 1946 | 1941 I 1946 | 1941 ALBERTA 1 803,330|796,169 Division No. 1—Continued: Rural . 44k934|489]583 Urban . 354.3961306.586 Division No. 2 . 60,982 58 563 Rural . 29,651 29,725 Division No. 1 . 31,256 29,595 5. Sugar City 5,116 4 749 Rural . 15,027 16,408 7. I.D. . 376 432 1 11). 806 947 8. I.D. (pt.) 179 202 1. I.D. 43 57 37. Sugar City 2,844 2 391 2. I.D. 104 148 38. I.D.7. 1,305 l’282 3. I.D. 167 169 67. I.D. (pt.) 412 442 31. I.D. 52 62 6. Cochrane . 3 735 4 233 32. I.D. 440 511 8. I.D. (pt.) 945 1,106 2. Burlington 1,275 1,440 9. I.D. . 1,311 1,538 33. Flowery Plains . 409 487 10. Cochrane . 1,479 1 589 34. Burlington . 866 953 8. I D 41 2 3. I.D.7. 2,242 2,505 39. Kerr (pt.) 2 4. I.D. 391 521 40. Castle River (pt. . 41 5. I.D. 994 1,067 9. Pincher Creek .... 3,135 3 363 6. I.D. 503 541 39. Kerr (pt.) . 1,422 1,532 35. I.D. 354 376 40. Castle River (pt.) 605 614 4. Warner . 1,940 1,871 70. Livingston . 1,108 1,217 36. Warner . 1,940 1,871 10. I I). 4 153 4 149 11 II). 3,774 4,756 71. I.D. 4,153 4,149 61. I.D. 565 740 15. I.D. (pt.) . 7,171 6,693 62. I.D. 534 615 67. I.D. (pt.) . 4,530 4,267 63. I.D. 514 609 16. Bright . 2 264 2,427 91. I.D. 917 1,164 68. I.D. (pt.) . 2,641 2,426 92. I.D. 705 890 39. Kerr . 68 93. I.D. 539 738 68. I.D. (pt.) . 374 423 12. Forty Mile 784 959 69. Bright . 1,187 1,153 64. Forty Mile . 784 959 99. Argyle (pt.) . 454 476 13. Bow Island 465 535 100. I.D.' (pt.'f . 249 307 94. Bow Island . . 465 535 26. Argyle (pt.) 1,248 1 516 14. Eureka . 1,120 1,098 99. Argyle (pt.) . 1,009 1,238 65. Eureka . 1,120 1,098 100. I.D.' (pt.)* ..'. 239 278 15. I.D. (pt.) 2,621 2,297 27. I.D. (pt.) 95 162 66. I.D. 2,621 2,297 101. I.D*. 95 162 Waterton Lakes Nat. Park 210 269 Urban . . 16,229 13,187 Indian Reserves . 2,483 2,162 Cities: Medicine Hat . 12,859 10,571 Urban . 31,331 28,838 Towns: Cities: Bow Island . 432 291 Lethbridge . 16,522 14,612 Irvine . 261 240 Towns: Taber . 1,760 1,331 Blairmore . 1,767 1,731 Villages: Cardston . 2,334' 1,864 Burdett . 110 123 Claresholm . 1,306 1,265 Milk River 4371 335 Coleman . 1,809 1,870 Warner . 370 296 Granum . 238 238](https://iiif.wellcomecollection.org/image/b31408412_0203.jp2/full/800%2C/0/default.jpg)