The decline of human fertility in the United Kingdom and other countries as shown by corrected birth-rates / by Arthur Newsholme and T.H.C. Stevenson.
- Newsholme, Arthur, 1857-1943.
- Date:
- [1906]
Licence: In copyright
Credit: The decline of human fertility in the United Kingdom and other countries as shown by corrected birth-rates / by Arthur Newsholme and T.H.C. Stevenson. Source: Wellcome Collection.
Provider: This material has been provided by The Royal College of Surgeons of England. The original may be consulted at The Royal College of Surgeons of England.
10/66 page 4
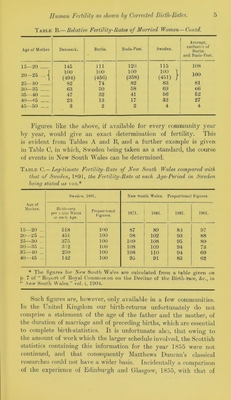
![Table A.—Number of Births per Annum per 1,000 Wives at each Age- Period. Age of Mother. Kdiitburj'h mid Glasgow, 1855. Alsace-Lorraine, 1872. Norwav, 1874-76. Finland, 1880-81. 15—20 500 465 413 379 20—25 418 563 579 406 25—30 346 463 430 357 30—35 266 388 360 322 35—40 204 282 300 261 40—15 80 — 181 158 45—50 13 — 33 27 50-55 *“” Age of Mother. Brunswick, 1830-81. Oemnark, 1880-80. Berlin, 1887-90. Buila-Pest, 1889-92. Sweden, 1891. 15—20 581 715 503 428 518 20—25 454 494 456 358 451 25-30 347 405 336 292 375 30—35 268 312 225 206 312 35—40 198 230 145 147 250 40—45 81 114 60 59 142 45—50 11 13 7 7 20 50—55 — — 0-2 07 — The general law of decline of fertility with advancing age is clearly shown in each of the above communities. In the following table the same facts are set out in another manner, which enables the relative fertility at different ages in each community to be more easily appreciated. This table cannot, of course, be employed to compare the fertility in different communities. Table B.—Relative Fertility-Rates of Married Women, the Fertility-Rate for the Age-Period 20—25 being taken as ioo. [The actual fertility-rate per i,ooo married women aged 20—25 is given in brackets for each community.] Age of Mother. Edinburgh and Glasgow. Alsace- Lorraine. Norway. Finland. Brunswick. 15 20 120 83 71 9t 128 f 100 IOO 100 100 100 20—25 ... | (418) (563) (579) (406) (454) 25—30 83 82 74 88 76 30—35 61 69 62 79 59 35 40 49 50 52 65 44 40—45 19 — 31 39 18 45 50 3 6 7 2](https://iiif.wellcomecollection.org/image/b22401520_0012.jp2/full/800%2C/0/default.jpg)


 No text description is available for this image
 No text description is available for this image
 No text description is available for this image