The decline of human fertility in the United Kingdom and other countries as shown by corrected birth-rates / by Arthur Newsholme and T.H.C. Stevenson.
- Newsholme, Arthur, 1857-1943.
- Date:
- [1906]
Licence: In copyright
Credit: The decline of human fertility in the United Kingdom and other countries as shown by corrected birth-rates / by Arthur Newsholme and T.H.C. Stevenson. Source: Wellcome Collection.
Provider: This material has been provided by The Royal College of Surgeons of England. The original may be consulted at The Royal College of Surgeons of England.
50/66 page 40
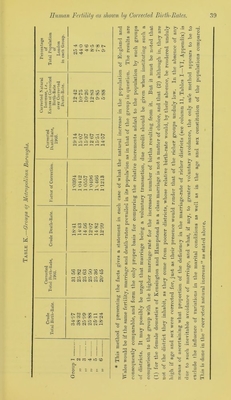
![APPENDIX. Table I.—Divisions of 1 2 3 4 5 Factor for Factor Standard Legitimate Correction of Crude Crude Legitimate Corrected Legitimate for Correction of Illegitimate Birth-Rate. Legitimate Birth-Rate. Birth-Rate. Birth-Rate. Birth-Rate. f 1901 34-91 1 27-29 27-29 1 1891 33 63 1 0381 30 1 3L-25 1055 England and Wales «{ '81 34-34 10166 32-2 3273 1131 'll 3 4-78 1-0037 330 33-12 1142 l ’61 3195 0 9989 32-4 32-36 1-109 Selected urban 1901 3690 0-9461 28-75 27-20 1 '985 counties* * * § ] 1881 36-79 0-9489 33-83 32TO 1-101 Selected rural ri90L 29 08 1-1762 23-83 28-03 1045 counties [1881 29-36 11890 28-67 34 09 1184 All urban districts!.. ..1901 36-40 09591 — — U'963 All rural districts .. ..1901 39-98 1-1644 — — 1147 Scotland^ • 1901 30-18 1-1567 27-36 31-65 0 944 [ 1881 29-57 1-1806 3089 36-47 1007 North Scotland § .... - r loot 26-83 1-3011 2454 3T93 0-922 [ 1881 2589 1-3484 27-83 37-53 0 971 South Scotland .... ■ r 1901 32 35 1-0791 29 16 31-47 0-961 [ 1881 32-32 1-0801 33-16 3582 1 035 Scotland N - 1901 20-04 1-7420 1957 3409 0-o3» L 1881 20-18 1-7299 22-68 3923 0 924 Scotland N.W - r 1901 2053 1-7004 21-32 3625 0 913 [ 1881 21-06 1-6576 2472 40-98 0-915 Scotland S.W -j f 1901 33 92 1-0292 31-43 32-35 1 021 [1881 34-05 1-0253 3506 35t 5 1095 IllELAND -1 r 1901 _ 1881 2205 2406 1-5832 1-4510 22- 48 23- 84 35-59 34-59 0 835 0938 Leinster -< [ 1901 23 15 1 5080 22 55 3401 0-811 [1881 24-76 1-4099 23-96 33 78 0890 Ulster < f 1901 23-80 14668 23 51 34-4S 0 813 [ 1881 24'24 1-4402 2378 34-25 0863 Munster • r ] 901 _ 1881 19-86 23-00 1-7578 1-5178 21 82 2367 38-36 35-93 0 851 1018 Connaught 4 0 [1901 19-43 1-7967 2LT4 37-98 0 919 L 1881 24-22 1-4414 2331 33-60 1-695 * The special urban counties and rural counties are trvo groups selected by the industrial centres, and comprising a population in 11)03 of 18,039,289, the second 4.314,254. According to tire Census Report, the first group comprises 89 per cent, of Many of the iriban districts in the second group are doubtless only villages, while in f The population of all the urban districts of England and Wales in 1901 was X All the recent Scottish birth-rates are for 1P02, all others for 1903. § Scotland is divided for registration purposes into eight divisions, termed Scotland Scotland, and the three southern South Scotland. The statistics for these two main subdivisions, which have been selected from the eight as likely to show the greatest Caithness, and Sunderland; Scotland N.W. includes Ross and Cromarty and Inverness;](https://iiif.wellcomecollection.org/image/b22401520_0052.jp2/full/800%2C/0/default.jpg)


 No text description is available for this image
 No text description is available for this image
 No text description is available for this image