[Report 1905] / Medical Officer of Health, Southampton County Borough.
- Southampton (England). County Borough Council.
- Date:
- 1905
Licence: Attribution 4.0 International (CC BY 4.0)
Credit: [Report 1905] / Medical Officer of Health, Southampton County Borough. Source: Wellcome Collection.
64/90 (page 64)
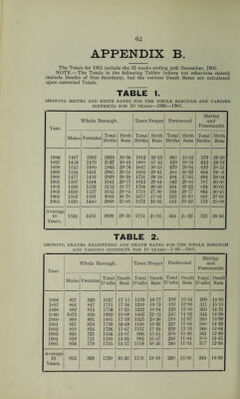
![APPENDIX B. The Totals for 1905 include the 52 weeks ending 30th December, 1905. NOTE.—The Totals in the following Tables (where not otherwise stated) include Deaths of Non-Residents, but the various Death Rates are calculated upon corrected Totals. TABLE 1. SHOWING BIRTHS AND BIRTH RATES FOR THE WHOLE BOROUGH AND VARIOUS DISTRICTS FOR 10 YEARS—1896—1905. Year. Whole Borough. Town Proper Portswood Shirley and Freemantle Males Females Total Births Birth Rate Total Births Birth Rate Total Births Birth Rate Total Births Birth Rate 1896 1467 1392 2859 30 36 1912 3213 368 25-82 579 28-38 1897 1458 1479 2137 30-43 1886 3143 439 28-78 612 28-73 1898 1545 1400 2945 29-76 1847 30-55 479 29-94 619 28-51 1899 1534 1461 2995 29 ’55 1803 29-61 508 30-32 684 28-s6 1900 1477 1452 2929 28 30 1751 28*38 484 27 65 694 28-04 1901 1597 1544 3141 29-77 1812 29-44 542 29-86 787 30-50 1902 1593 1559 3152 28-77 1764 28-09 564 29-22 824 30-05 1903 1638 1527 3165 28-84 1718 27.80 583 29-77 864 30-45 1904 1502 1501 3003 26-78 1677 27-01 525 25-39 801 27-01 1905 1428 1440 2868 25 05 1572 24-92 543 25-42 753 25'04 Average 10 1524 1476 2999 28* / U 1774 28-96 504 2o'22 722 2856 Years. TABLE 2. SHOWING DEATHS REGISTERED AND DEATH RATES FOR THE WHOLE BOROUGH AND VARIOUS DISTRICTS FOR 10 YEARS—l«9(j—19l)5. Year. Whole Borough. Town Proper Portswood Shirley and Freemanjle Males Females Total D’aths Death Rate Total D’aths Death Rate Total D’aths Death Rate Total D’aths Death Rate 1896 837 820 1657 17-15 1170 18-77 188 13-54 299 14-95 1897 864 847 1711 17-34 1209 19-73 191 12-98 311 15-11 1898 882 874 1756 1725 1222 18-94 229 15-00 305 14-31 1899 1072 920 1992 19-08 1402 21-82 246 14-92 344 14-98 1900 990 891 1881 17-59 1325 20-36 218 12-97 338 13-99 1901 931 858 1789 16-48 1188 18-23 221 12-84 380 14-92 1902 910 816 1726 15-47 1137 17-24 229 12-53 360 13-64 1903 836 721 1556 13-87 996 15-45 200 10-36 361 12-83 1904 839 751 1590 13-83 992 1507 238 11 -84 SCO 12-65 1905 956 779 ] 735 14-57 1118 ] 6*26 240 11 -85 377 12-94 Average 14-03 10 Years. 912 828 1739 16-26 1176 18-19 220 12-88 344](https://iiif.wellcomecollection.org/image/b30117847_0064.jp2/full/800%2C/0/default.jpg)