Annual report of the Medical Officer of Health / City Council of Pretoria.
- Pretoria (South Africa). Health Department.
- Date:
- [1965]
Licence: Public Domain Mark
Credit: Annual report of the Medical Officer of Health / City Council of Pretoria. Source: Wellcome Collection.
29/192 page 25
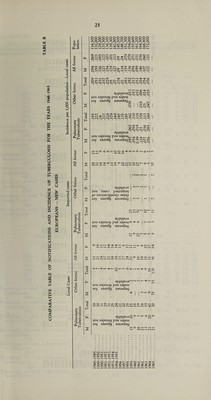
![AGE GROUPS Tables C and C.l which follow, show the incidence of Tuberculosis in age groups for Europeans and Non-Europeans respectively, over the past 13 years, together with the percentage of the total cases reported in each group for that year: TABLE C EUROPEAN CASES —LOCAL AND IMPORTED 0-1 2-5 6-10 11-20 21-40 41 and Total over M F M F M F M F M F M F M F 1953. 2 1 1 - 1 — — 1 9 14 16 6 29 22 1954. 1 — 3 - 3 1 — 3 6 10 16 8 39 22 1955. 2 1 — 4 3 2 5 — 10 11 17 8 37 26 1956. — — 2 2 1 1 — 1 3 13 26 6 22 23 1957. — — 3 - 1 3 4 2 10 13 19 4 37 22 1958. - - 2 3 3 2 3 1 11 4 26 6 45 11 1959. - - 4 2 1 3 — 4 12 7 21 5 38 20 Percentage of total Tuberculosis notifications. 10% 7% 7% 32% 44% 1960. - - 1 1 1 1 1 1 6 7 10 6 19 16 Percentage of total Tuberculosis notifications. 5% 5% 5% 39% 46% 1961. — — — 1 - - 1 — 9 5 16 3 26 10 Percentage of total Tuberculosis notifications. 3% — 3% 40% 54% 1962. 1 — — 1 1 2 — 6 2 21 5 31 8 Percentage of total Tuberculosis notifications. 2% — 5% 5% 21% 67% 1963. — 1 — 1 — 2 3 1 5 7 16 4 24 16 Percentage of total Tuberculosis notifications. 2% 3% 5% 10% 30% 50% 1964. — 1 9 ] LI 2 — 2 1 5 4 18 ] 12 36 29 Percentage of total Tuberculosis notifications. 0.6% 31% 3% 6% 14% 46% 1965. 10 10 64 47 2 1 1 — 7 1 12 5 96 64 Percentage of total Tuberculosis notifications. 12.5% 69% 1.8% 0.6% 5°/ J /0 11% TABLE C I. NON-EUROPAN CASES — LOCAL AND IMPORTED 0-1 2-5 6-10 11-20 21-40 41<Stover Total M F M F M F M F M F M F M F 1953. 4 4 18 14 10 6 14 16 82 58 67 18 195 116 1954. 11 3 31 39 11 12 20 24 82 75 121 47 276 200 1955. 11 7 37 33 24 17 21 36 98 93 133 41 324 227 1956. 13 6 45 38 25 78 23 40 112 91 81 24 299 111 1957. 12 2 36 47 24 25 28 28 119 102 134 34 350 238 1958. 7 11 51 46 33 34 41 46 136 107 175 38 442 282 1959. 10 8 49 62 25 21 34 50 158 106 132 47 408 284 Percentage of total Tuberculosis notifications. 2% 14% 6% 13% 38% 36% 1960. 13 17 57 58 18 23 25 37 146 107 141 36 401 278 Percentage of total Tuberculosis notifications. 5% 17% 6% 9% 37% 26% 1961. 28 18 83 97 33 44 43 44 183 138 167 49 537 390 Percentage of total Tuberculosis notifications. 5% 19% 8% 9% 35% 24% 1962. 45 29 81 63 31 47 37 58 172 126 190 51 556 374 Percentage of total tuberculosis notifications. 8% 16% 8% 10% 32% 26% 1963. 26 34 54 70 24 26 31 55 190 120 155 380 480 343 Percentage of total tuberculosis notifications. 7% 15% 6% 10% 38% 24% 1964. 32 24 86 83 20 25 25 41 207 112 166 33 536 318 Percentage of total tuberculosis notifications. 8% 20% 3% 8% 37% 23% 1965. 61 63 109 160 22 36 21 45 181 80 171 32 565 416 Percentage of total tuberculosis notifications. 13% 27% 6% 9°/ ~ /o 27% ? 1 °/ /o](https://iiif.wellcomecollection.org/image/b31488808_0029.jp2/full/800%2C/0/default.jpg)