[Report of the Medical Officer of Health for Paddington, Borough of ].
- Paddington (London, England). Parish. Vestry.
- Date:
- [1897]
Licence: Attribution-NonCommercial 4.0 International (CC BY-NC 4.0)
Credit: [Report of the Medical Officer of Health for Paddington, Borough of ]. Source: Wellcome Collection.
39/145 page 39
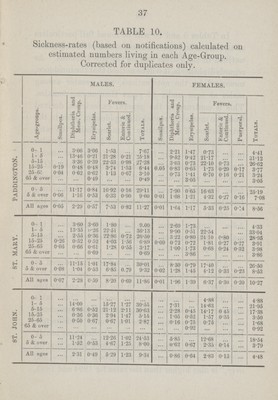
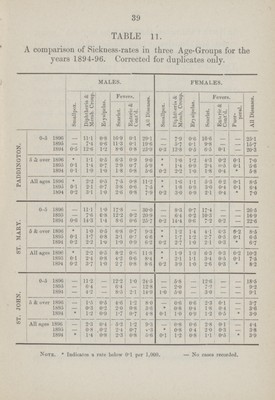
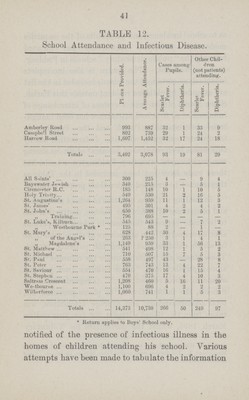
![39 TABLE ll. A comparison of Sickness.rates in three Age.Groups for the years 1894.96. Corrected for duplicates only. MALES. FEMALES. Smallpox. Diphtheria & Memb. Croup. Erysipelas. Fevers. All Diseases. Smallpox. Diphtheria & Memb. Croup. Erysipelas. Fevers. All Diseases.[/##] Scarlet. Enteric & | Cont'd. Scarlet. Enteric & Cont'd. Puer peral. PADDINGTON. 0.5 1896 — 11.1 0.8 16.9 0.l 29.1 — 7.9 0.6 16.6 — — 25.1 1895 — 7.4 0.6 11.3 0.l 19.6 — 5.7 0.1 9.8 — — 15.7 1894 0.5 12.6 1.2 8.6 0.8 23.9 0.3 12.8 0.5 6.5 0.1 — 20.3 5 & over 1896 * 1.1 0.5 6.3 0.9 9.0 * 1.0 1.2 4.3 0.2 0.1 7.0 1895 0.1 1.4 0.7 2.9 0.7 5.9 * 1.4 0.9 2.4 0.5 0.1 5.6 1894 o.l 1.9 1.0 1.8 0.8 5.6 0.2 2.2 1.0 1.8 0.4 * 5.8 All ages 1896 * 2..2 0.5 7.5 0.8 11.2 * 1.6 1.1 5.3 0.2 0.1 8.5 1895 0.1 2.1 0.7 3.8 0.6 7.5 * 1.8 0.9 3.0 0.4 0.1 6.4 1894 0.2 3.1 1.0 2.6 0.8 7.9 0.2 3.0 0.9 2.1 0.4 * 7.0 ST. MARY. 0.5 1896 — 11.1 1.0 17.8 30.0 — 8.3 0.7 17.4 — — 26.5 1895 — 7.6 0.8 12.2 0.2 20.9 — 6.4 0.2 10.3 — — 16.9 1894 0.6 14.3 1.4 8.6 0.6 25.7 0.2 14.4 0.6 7.2 0.2 — 22.6 5 & over 1896 * 1.0 0.5 6.8 0.7 9.3 * 1.2 1.4 4.1 0.3 0.2 8.5 1895 0.1 1.7 0.8 3.1 0.7 66 * 1.7 1.2 2.7 0.5 0.1 6.5 1894 0.2 2.2 1.0 1.9 0.9 6.2 0.2 2.7 1.0 2.1 0.3 * 6.7 All ages 1896 * 1.1, 0.5 8.2 0.6 118 * 1.9 1.3 6.3 0.3 0.2 10.2 1895 0.1 2.4 0.8 4.2 0.6 8.4 * 2.1 1.1 3.4 0.5 0.1 7.5 1894 0.2 3.7 1.0 2.7 0.8 8.6 0.2 3.9 1.0 2.6 0.3 * 8.2 ST. JOHN. 0.5 1896 — 11.2 — 12.2 1.0 24.5 — 5.8 — 12.6 — — 18.5 1895 — 6.4 — 6.4 — 12.8 — 2.0 — 7.2 — — 9.2 1894 — 4.2 — 8.5 2.1 14.9 1.0 5.0 — 3.0 — — 9.1 5 & over 1896 — 1.5 0.5 4.6 1.2 8.0 — 0.6 0.6 2.3 0.1 — 3.7 1895 — 0.3 0.2 2.0 0.8 3.6 * 0.8 0.4 1.8 0.4 — 3.6 1894 * 1.2 0.9 1.7 0.7 4.8 0.1 10 0.9 1.2 0.5 * 3.9 All ages 1896 2.3 0.4 5.2 1.2 9.3 — 0.8 0.6 2.8 0.1 — 4.4 1895 — 0.8 0.2 2.4 0.7 1.3 * 0.8 0 4 2. 0 0.3 — 3.8 1894 * 1.4 0.8 2.3 0.8 5.6 0.1 1.2 0.8 1.1 0.5 * 3.9 Note. * Indicates a rate below 0.1 per 1,000. — No cases recorded.](https://iiif.wellcomecollection.org/image/b18245158_0039.jp2/full/800%2C/0/default.jpg)