On Bengal dysentery and its statistics : with a notice of the use of large enemata in that disease, and of quinine in remittent fever / by John Macpherson.
- John Macpherson
- Date:
- 1850
Licence: Public Domain Mark
Credit: On Bengal dysentery and its statistics : with a notice of the use of large enemata in that disease, and of quinine in remittent fever / by John Macpherson. Source: Wellcome Collection.
Provider: This material has been provided by The Royal College of Surgeons of England. The original may be consulted at The Royal College of Surgeons of England.
17/70 page 11
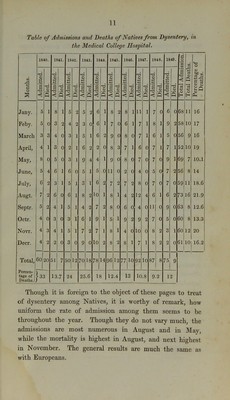
![Table of Admissions and Deaths of Natives from Dysentery, in the Medical College Hospital. 1840. 1841. 1842. 1843. 1844. 1845. 1846. 1847. 1848. 1849. d .2 'co O Months. | Admitted. 1 Died. I Admitted. 1 Died. Admitted. 1 Died. Admitted. Died. Admitted. 1 I Died. Admitted. 1 Died. Admitted. 1 Died. Admitted. 1 Died. Admitted. 1 Died. | Admitted. I Died. | Total Admii [ Total Death Percentage Deaths. Jany. 5 1 8 1 5 2 5 2 6 1 8 2 8 1 11 1 7 0 6 0 68 11 16 Feby. 5 0 3 2 4 2 3 0 6 1 7 0 6 1 7 1 8 1 9 2 58 10 17 March 3 3 4 0 3 1 5 1 6 2 9 0 8 0 7 1 6 1 5 0 56 9 16 April, 4 1 3 0 2 1 6 2 2 0 8 3 7 1 6 0 7 1 7 1 52 10 19 May, 8 0 5 0 3 1 9 4 4 1 9 0 8 0 7 0 7 0 9 1 69 7 10.1 June, 5 4 6 1 6 0 5 1 5 0 11 0 2 0 4 0 5 0 7 2 56 8 14 July, 6 2 3 1 5 1 3 1 6 2 7 2 7 2 8 0 7 0 7 0 59 11 18.6 Augt. 7 2 6 0 6 1 8 2 10 1 8 1 4 2 12 4 6 1 6 2 73 16 21.9 Septr. 5 2 4 ] 5 1 4 2 7 2 8 0 6 0 4 0 11 0 9 0 63 8 12.6 Octr. 4 0 3 0 3 1 6 1 9 1 5 1 9 2 9 2 7 0 5 0 60 8 13.3 Novr. 4 3 4 1 5 1 7 2 7 1 8 1 4 0 10 0 8 2 3 1 60 12 20 Deer. 4 2 2 0 3 0 9 0 10 2 8 2 8 1 7 1 8 2 2 0 61 10 16.2 Total, 6o| 20 51 7 50 12 70 18 78 14 96 12 77 10 92 10 87 8 75 9 Percen- tage of Deaths.' [33 13.7 24 25.6 18 12.4 13 10.8 9-2 12 Though it is foreign to the object of these pages to treat of dysentery among Natives, it is worthy of remark, how uniform the rate of admission among them seems to be throughout the year. Though they do not vary much, the admissions are most numerous in August and in May, while the mortality is highest in August, and next highest in November. The general results are much the same as with Europeans.](https://iiif.wellcomecollection.org/image/b22384108_0019.jp2/full/800%2C/0/default.jpg)


 No text description is available for this image
 No text description is available for this image
 No text description is available for this image