Meals on Wheels for old people / by Amelia I. Harris.
- Great Britain. Central Office of Information. Social Survey Division
- Date:
- [1961]
Licence: Public Domain Mark
Credit: Meals on Wheels for old people / by Amelia I. Harris. Source: Wellcome Collection.
13/116 page 5
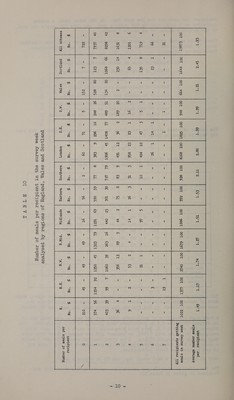
![De Apes =o Number of recipients per scheme and organisation responsible Red WVS & WVS OPWC Grogs OPwc L.A. All schemes No. of people served L No. % Under 10 - 22 5 ; 10-19 + 94 Z| | 20 - 29 = oy 2k | | 30 - 39 - Sa 40 ~ 59 ~ 73 4 14 60 - 79 40 37 7 80 - 99 0. ee Rare | 100 - 149 20; 24 5 | 150 & over 20 15 is | | 100} 453 100 | Total re J If we regard schemes with under 30 recipients as small, 30-59 as medium, and 60 as large, Table 5 will show that the difference for Red Cross is due to a tendency to a high proportion of small, and a low proportion of large schemes, while the joint W.V.S. and O.P.W.C. difference is the high propor- tion of small and low proportion of medium schemes. There is however no evidence that the size of schemes is influenced by the type of organisation responsible. PeRIbeL B Organisations responsible for small, medium and large schemes Organisation responsible s , chenme — — Red OPWC + Local AlL ae Cross W. VaS- Auth. schemes | No. @ No. @& No. @ No. & Small (under 30 recipients) 167 48 16 50 a 213° 47 Medium (30-59 w ) 104 =30 9 99 Or t= 140 31 Large (60 & over ) vay 7) (mea 5100 | BOO ** 22 348 100 | 52 100 | 16 100] 32 100 | 5 100 | 453 100 | aes | ; | pent Bird pore) ¢ There are, however, differences between the size of schemes over the 10 regions of England and Wales, and Scotland, as will be seen from Table 6.](https://iiif.wellcomecollection.org/image/b32174482_0013.jp2/full/800%2C/0/default.jpg)

 No text description is available for this image
 No text description is available for this image
 No text description is available for this image